
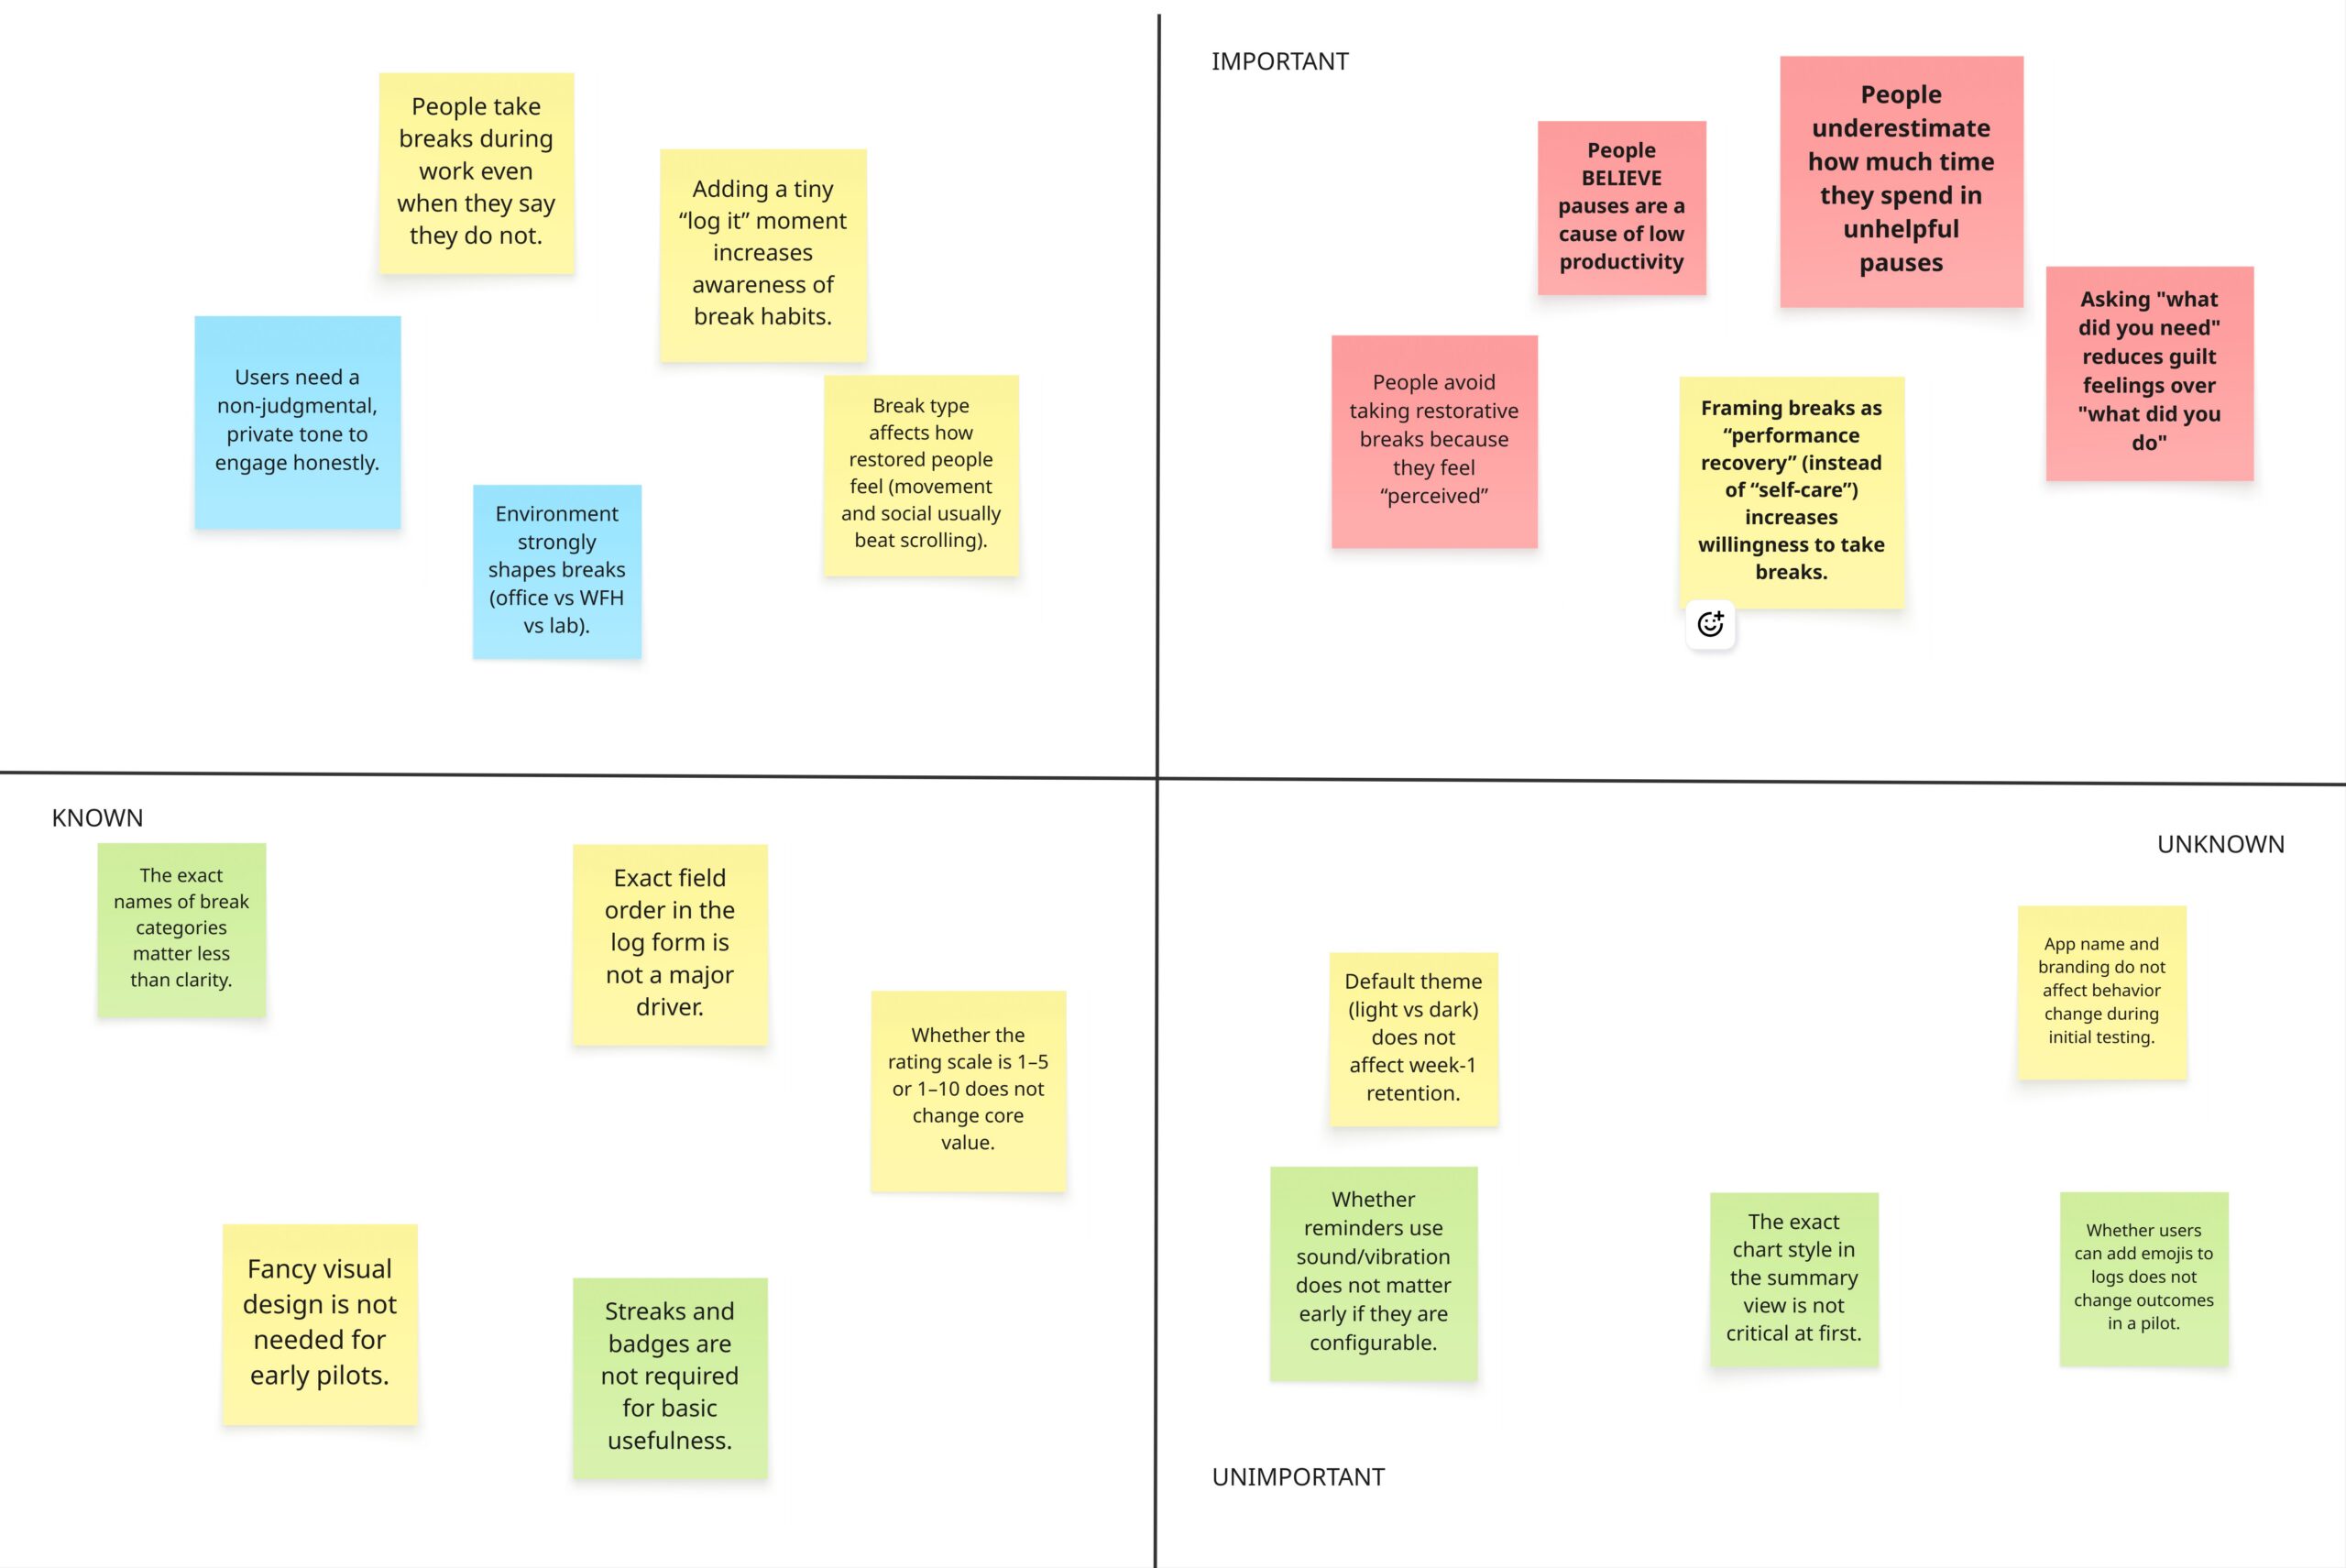
Our assumptions point to a product where the hardest part is not building proper logging. The hardest part is handling guilt, motivation, and trust so people keep using it and log honestly.
Assumption 1: People believe pauses are a cause of (feelings of) low productivity
There are two interpretations: first, that we may struggle to get people to our app in the first place if people do not think it is tackling a core component; and second, that people often think their pauses are the main reason they are not getting enough done. This matters because they may come in wanting fewer breaks, not better breaks.
| Impact Area | Potential Impact Severity |
| Desirability | If people strongly believe this, the app feels immediately relevant and urgent. |
| Feasibility | If we can quickly improve perceived productivity, people may stick with it and recommend it. |
| Viability | This assumption mostly affects the type of feedback the app must provide quickly. |
Assumption 2: People underestimate how much time they spend in unhelpful pauses doomscrolling avoidance until they see a breakdown
The core value can be the reveal. People may not change habits until they see patterns in time, triggers, and after-effects. But the reveal must feel safe or people will avoid logging.
| Impact Area | Potential Impact Severity |
| Desirability | High if the breakdown feels useful and not shameful. |
| Feasibility | Depends on fast logging and reliable summaries. Still feasible for an MVP. |
| Viability | Strong because weekly breakdowns can create a reason to return. |
Assumption 3: Framing breaks as performance recovery (instead of self-care) increases willingness to take breaks.
Many high-achievers avoid breaks because they feel undeserved. Performance recovery framing can make breaks feel legitimate and strategic. That can reduce guilt and increase follow-through.
| Impact Area | Potential Impact Severity |
| Desirability | Likely increases interest and reduces resistance. |
| Feasibility | Very easy to implement and test quickly. |
| Viability | If framing reduces guilt, it can improve retention and referrals. |
Assumption 4: A log prompt that asks What did you need? (tired, anxious, stuck) leads to more honest entries than What did you do?
A question like what did you need can make logging feel supportive. A question like what did you do can feel like a report card. Honesty is the foundation for useful insights. Need-first prompts can feel kinder and more reflective, which may increase reporting of stigmatized breaks like doomscrolling. If the app cannot get honest logs, it cannot deliver credible insights.
| Impact Area | Potential Impact Severity |
| Desirability | Higher trust and comfort leads to continued use. |
| Feasibility | Simple to build as an A/B test in the logging flow. |
| Viability | Better data quality improves insights, which supports long-term value. |
Designing Assumption Tests
Test Card 1: Pause blame survey
STEP 1: HYPOTHESIS
We believe that people believe pauses are a major cause of low productivity.
STEP 2: TEST
To verify that, we will run a 3-minute survey. We will ask people to rate agreement with common causes of low productivity and then pick their top 3 causes.
STEP 3: METRIC
And measure:
- Percent who rate the assumption as high agreement on a 1 to 7 scale
- Percent who put pauses in their top 3 causes
STEP 4: CRITERIA
We are right if:
- At least 40 percent rate high agreement, or
- At least 30 percent rank pauses in their top 3 causes
Test Card 2: Unhelpful pause estimate vs reality
STEP 1: HYPOTHESIS
We believe that people underestimate how much time they spend in unhelpful pauses.
STEP 2: TEST
To verify that, we will ask participants to estimate yesterday’s minutes spent in doomscrolling or avoidance breaks. Then they will log breaks for 3 days using a fast form. At the end, we show a breakdown and ask if it was more than expected.
STEP 3: METRIC
And measure:
- Median percent difference between estimate and logged time
- Percent who say the breakdown was surprising on a 1 to 5 scale
- Percent who say they want to change one break habit after seeing the breakdown
STEP 4: CRITERIA
We are right if:
- Median underestimation is at least 20 percent, and
- At least 60 percent report surprise
Test Card 3: Framing A/B on willingness
STEP 1: HYPOTHESIS
We believe that framing breaks as performance recovery (instead of self-care) increases willingness to take breaks.
STEP 2: TEST
To verify that, we will A/B test two versions of a short landing page or onboarding screen with the same features:
- Version A uses self-care framing
- Version B uses performance recovery framing
Then we ask one quick question about willingness to use daily.
STEP 3: METRIC
And measure:
- Percent who click start or join pilot
- Self-reported willingness to use daily on a 1 to 7 scale
- Self-reported guilt about taking breaks on a 1 to 7 scale
STEP 4: CRITERIA
We are right if:
- Version B improves click-through by 15 percent relative, or
- Version B increases willingness by at least 0.5 while not increasing guilt
Test Card 4: Need-first vs do-first logging A/B
STEP 1: HYPOTHESIS
We believe that a log prompt that asks What did you need? (tired, anxious, stuck) leads to more honest entries than What did you do?
STEP 2: TEST
To verify that, we will run an A/B test in the logging flow during a 5-day pilot:
- Version A prompts activity first
- Version B prompts need first
Both collect the same fields, just different wording and order.
STEP 3: METRIC
And measure:
- Log completion rate
- Percent of logs that include doomscrolling or avoidance
- Self-reported honesty and comfort after logging on a 1 to 5 scale
- Drop-off after day 1
STEP 4: CRITERIA
We are right if:
- Version B increases doomscrolling or avoidance reporting by at least 20 percent relative, and
- Version B does not reduce completion rate by more than 5 percent, and
- Honesty or comfort is higher by at least 0.3 on a 1 to 5 scale
Comments