Introduction
Our team consists of Andreea Jitaru, Ingrid Nordberg, Izzy Meyerson, Jen Quach, and Riley Pittman. Our team name is Meerkat. Our project goals are to gain insights into reading-related behaviors of college students and young professionals, and to use those insights to design a solution that facilitates the development of consistent reading habits.
Problem Space – Baseline Study
Our team conducted this baseline study to understand the reading habits of college students and young professionals (ages 19-24) seeking to read more regularly. We aimed to identify their reading preferences, frequency, and obstacles to inform strategies that encourage building a consistent reading habit. We did this in response to the study’s problem: that college students and young professionals want to read consistently but many currently don’t.
Methodology
We conducted a four-day diary study where participants logged their reading activities and instances of intended but obstructed reading. Each entry captured logistical details (time, location, and interruptions) and content data (motivations and reading materials). Participants spent about two minutes per entry, logging sessions via a Google Form, with daily email reminders. Data was automatically compiled for analysis in a spreadsheet.
Participant Recruitment
Participants were recruited through a screener questionnaire targeting students and young professionals aged 19 to 24 that are interested in developing a reading habit. The participants were recruited through convenience and snowball sampling. Our primary selection criteria was an interest in building a reading habit, as our focus was on habit formation rather than fostering initial interest in reading.
Key screener questions included:
- How often do you read?
- Do you want to read more?
- Do you consider reading important?
Key research questions included:
- What are the reading habits of young adults who want to read more?
- What types of materials do they read, and through which mediums?
- What common obstacles hinder their reading?
- How do time and location impact their reading activities?
These insights will guide interventions to help young adults establish and maintain a regular reading habit.
Raw Data and Grounded Theory
After collecting and reviewing our raw data, we met multiple times to synthesize insights about our user base. Our raw response data can also be viewed here. To get to our Grounded Theory, we used multiple analysis techniques to investigate our data.
Affinity Grouping & Timeline Grouping
We used affinity mapping to categorize data into themes, conflicts, and tensions, pulling quotes directly from our study. The biggest obstacles to reading were:
- Busy schedules and heavy academic workloads.
- A preference for “mindless” activities like TV or social media at the end of the day.
- Reading being seen as a way to “gain knowledge”, not relax.
- Use of multiple reading mediums, with digital being the most common.

We examined when participants wanted to read versus when they actually did. Many hoped to read in the morning but felt overwhelmed by daily responsibilities. Those preferring nighttime reading cited exhaustion as a major obstruction.

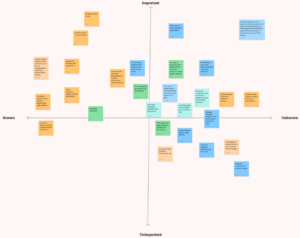
We created a 2×2 matrix to assess the significance and actionability of key themes deduced from the baseline study. This helped determine which obstacles could be effectively addressed based on available information. The Figma link can be found here for your convenience.

Key Trends, Insights, and Contradictions
1) People want to read but struggle with busy schedules.
Multiple people who we surveyed with our Baseline Study cited busyness of their schedule as a reason why they were obstructed to read, showing that even though they want to read this want doesn’t supersede their busy schedule.
2) Phones and TV are major distractions for would-be readers.
One student wrote that they chose not to read because they were “tired from school” and “just [wanted] to watch Netflix instead”. This shows how the easy dopamine release from digital distractions draw people away from more difficult tasks such as reading.
3) Reading feels mentally taxing after a long day, especially for students.
When describing why they weren’t able to read, one college-aged participant wrote, “I had a packed schedule of work and events all day until 10pm and felt [too] tired to put in effort to do anything other than sleep”. Unlike many adults who mainly work between the hours of 9am and 5pm, college students frequently have responsibilities all day, from the morning to the evening. For many college students, this leaves them with the main chunk of free time being in the later evening. This quote shows the student was too drained to expend the effort required to read in the evening due to all the responsibilities.
4) Most participants prefer digital mediums, though some still favor physical/audiobooks.
One reason why participants favored physical/non-digital books was getting them “off screens”, but many participants also read a lot on their phones or on their computers, which are just so convenient as compared to having to bring a physical book around with them.
5) The biggest motivators for reading are to be part of the cultural conversation and to gain more knowledge.
Participants mentioned wanting to “read more nonfiction” and “learning more about new perspectives [and] topics” showing how the thirst for knowledge and understanding the world better is a large driver of people’s interest in reading.
These learnings will inform interventions to help users integrate reading into their routines.
System Models
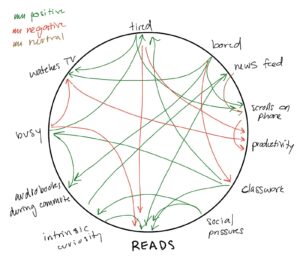
In order to better understand the relationships between different themes and habits, we used system models to synthesize our Grounded Theory findings. These models helped visualize key patterns, contradictions, and emergent insights from our research. Below, you will see our fishtail cause and effect model and feedback loops.
Patterns, Contradictions, Emergent Insights
- From the fishtail diagram, we see that reading on the toilet is a poorly developed method for successful reading habits, which might seem strange in a behavior change context because it seems like a great example of habit stacking. However, there is a time limit for toilet reading because people generally don’t spend much time on the toilet. From this, a next step could be to take advantage of peoples’ willingness to engage in habit stacking but on a behavior that does not necessarily carry a time limit.
- From the fishtail diagram, we see that distractions can easily derail a reader from reading, even with just one phone notification, especially because many people try to force themselves to read (e.g. early in the morning) which is an ineffective behavior change strategy. This shows that we need to not only fight against distractions to encourage reading habits but also to make reading the most obvious choice so people don’t have to force themselves to read.
- From the feedback loop, we can see that scrolling on one’s phone is a behavior that results from being tired, bored, or going through one’s news feed. This reflects how there is so little friction associated with scrolling on one’s phone – one just has to unlock the phone and everything is at one’s fingertips, as opposed to reading, where there is more friction (one has to make the conscious decision to do something more out of the ordinary and less dopamine inducing)
- From the feedback loop, we can see that social pressures cause intrinsic curiosity which stimulates reading. This shows that even though reading is an individual activity, it can also simultaneously have a social component, as people influence and are influenced by each other’s behaviors and perceptions of each other.
Secondary Research
Literature Review
We examined 10 research articles on reading habits, identifying barriers to reading, shifts in reading behavior due to digital innovation, and motivational factors that influence reading habits. Our key findings are listed below:
1) Reading is prevalent but not always book-focused:
Studies show college students read extensively on digital platforms, with social media and academic materials competing for attention. This prompted us to refine our scope—should we target general reading habits or focus on leisure reading?
2) Digital reading dominates, but comprehension varies:
While young readers favor digital formats for accessibility, research suggests print fosters better comprehension, especially for early learners. This highlights the need for personalization in our approach.
3) External factors shape reading habits:
Family influence, academic encouragement, and material accessibility are significant in habit formation. Understanding these external motivators helps us design interventions that support long-term reading engagement.
Competitive Analysis
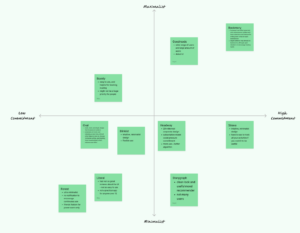
We analyzed 10 apps relevant to our problem space, examining both surface-level and deeper features. Each competitor provided insights into habit-building, user engagement, or reading-related functionalities. Our 2×2 map categorizes them along two axes: Low Commitment – High Commitment and Minimalist – Maximalist. Here is the Figma link for your convenience.
Axes Choice Rationalization:
- We chose Minimalist – Maximalist for the vertical axis because distraction has been one of the major themes of our project so far, and we wanted to gain further insights into the interface itself and if there is a strong correlation between either minimalism and maximalism and book-centered apps.
- We chose Low Commitment – High Commitment for the horizontal axis because we wanted more information about the spread of how much energy existing book-focused apps choose to ask from their users.
Key Insights & Market Trends:
1) Gamification & Habit Reinforcement:
Apps like Forest, Opal, and Strava use milestones and rewards to drive engagement. Reading apps such as Bookly and Bookmory incorporate gamification through reading streaks and progress tracking, though they require manual input, which may hinder adoption. We aim to explore ethical and effective gamification strategies to balance motivation and ease of use.
2) Social Engagement & Accountability:
Strava, Goodreads, and Storygraph integrate social elements to encourage participation. Forest enables competition among power users, with some utilizing monetary incentives for engagement. This inspired us to consider competitive, community-driven features similar to Fantasy Football.
3) Minimalist Design:
Given our focus on distraction-free engagement, minimalism became a key axis in our analysis. Apps like Forest, Opal, and Blinkist prioritize simplicity while maintaining user retention without promoting excessive screen time. This guides our UI/UX approach to ensure an intuitive yet compelling experience.
Proto-Personas
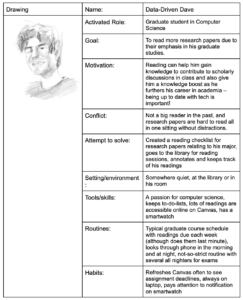
Persona #1: Data-Driven Dave
Persona #2: F.B.B.B (Find Better Book Brooke)

Persona Refinement Process
We selected DDD (Data Driven Dave) and FBBB (Find Better Book Brooke) as they represent two core motivations for reading: knowledge-driven reading and leisure reading to replace unproductive habits. DDD prioritizes academic success, leveraging structured habits like to-do lists and deadline tracking, while FBBB seeks relaxation but struggles with digital distractions.
By analyzing their existing habits, we identified general reading challenges (distractions, sustaining long reading sessions, finding quiet spaces) and personalized solutions (structured scheduling for DDD, gentle habit formation for FBBB). These distinctions guide our journey maps, ensuring tailored strategies for different reading behaviors.
Journey Maps
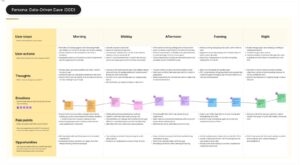
Link to higher quality Data-Driven Dave Journey map: Data-Driven Dave.
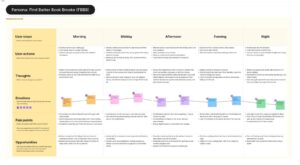
Link to higher quality Find Better Book Brooke Journey map: Better Book Brooke.
Key insights
Both FBBB and DDD experience morning optimism about their reading goals but face end-of-day guilt over unmet expectations. Their structured days reflect a commitment to time management, but their approaches differ: FBBB follows an idealistic schedule, leading to frustration when she falls behind or does not meet expectations, while DDD relies on to-do lists and deadlines, often cramming at the last minute.
Key insights from their journey maps highlight common pain points like overwhelm and guilt, which can be addressed for a better reading experience. Our intervention design and solutions should consider their realistic daily routines, avoiding overly rigid structures that may increase stress.
Solution Space – Intervention Design
Assumption Testing
To begin our assumption testing, we created an assumption map that characterized different ideas and insights found from our baseline studies across two different axes: the knowability/discoverability of something, the importance of that thing. This allowed us to clarify which problems areas we should hone in on when coming up with and storyboarding ideas.
Before embarking on our assumption testing, we had to define what we believed to be true about users. Our user assumptions are thus:
- Habit stacking can be effectively implemented in the reading space. This was informed by much of the literature we read for class as well as in-class lectures discussing habit stacking as a way to anchor a new habit to existing routine.
- We assumed, from our baseline interviews, that users read to accomplish a goal rather than reading strictly for pleasure.
- We also assumed from our baseline interviews that users are too tired at the end of the day to desire or enjoy reading.
To test our first assumption (habit stacking), we asked participants to read for 5 minutes while going to the bathroom, which is an already ingrained, biological routine. Surprisingly, we found that about 60% of our participants said they read while going to the bathroom, perhaps reinforcing our assumption (but not confirming it). This was perhaps a difficult habit to stack with, though most people reported reading on their phones which is unsurprising.
In order to determine what motivated readers and thus whether our second assumption was valid, we presented participants with two story options to read: a short, entertaining narrative story and an informative news piece. We found that about ¾ of participants chose the informative news piece. This could reflect wanting to stay up to date on news or other biases, but overall it enforces our belief that many people read because they want to know something.
For our final assumption test, we asked participants to read for 5-10 minutes at the start of their days and at the end of their days. We then asked them to rate their satisfaction levels for each reading session. All of our users reported slightly higher satisfaction with reading in the morning rather than at night. This insight made us consider how we could tailor our intervention to when a particular user prefers to read.
Storyboarding of Top Ideas [linked here]
Idea 1: Calendar Blocking
Our app would learn, via ML, which times throughout the day would be most ideal for a user to read and then would schedule blocks of reading into their calendar. This comes from our assumption that users are busy and overwhelmed rather than lazy.

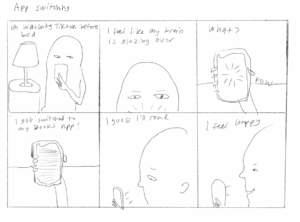
Idea 2: App Switcher
Users are automatically switched away from a social media app when they open one. This was inspired by baseline interviews where participants reported getting distracted easily by their phones.
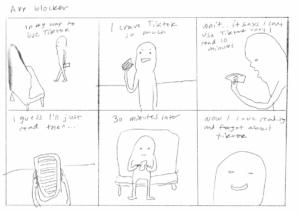
Idea 3: App Blocker
Users have to read for a discrete chunk of time (say, 10 minutes) before they are able to open any social media app like TikTok or Instagram.
Ultimately, we decided our idea #2, the app switcher, was the best and most viable option. Firstly, the calendar blocking idea is not aggressive or intrusive enough and would be easy for users to ignore. The encouragement provided by the app is passive rather than active. While the app blocker seemed to be a solid idea as many participants reported trying some similar functionality to prevent themselves from checking social media so often, they also reported these interventions didn’t typically stick because once an app was blocked, they became frustrated having nothing to do instead. They would promptly delete the app blocker. Our app switcher, on the other hand, has blocking capabilities but also gives a user desirable alternatives.
Intervention Study [study synthesis linked here]
We wanted to test whether our “app switcher” would be effective in prompting participants to read instead of scrolling through social media. However, for our intervention study, we wanted to use a very low fidelity prototype. So, instead of building out this app switcher, we told participants that if they opened a social media app during the four day study, they would immediately have to switch out and read for 10 minutes. While this certainly does not replicate the actual functionality of our app switcher, it is free and easy to implement and is an effective enough disruption for the user to prompt them to read.
To collect data during our study period, we created a google form that asked respondents to log any reading sessions or reading obstruction they encountered that day. A reading session is defined as a discrete period of time where the participant chooses to read. A reading obstruction is categorized as a moment, obligation, mood, feeling, or emotion that prevents the participant from reading that day.
For both the reading session and obstruction, we asked the participant what motivated them to read that day. If they faced an obstruction, we asked them to fill out details of what prevented them from reading. If they logged a reading session, we collected data on how long they read for, on what medium, what type/genre of text, the time of day, whether they were pushed to read by our pseudo app switcher or whether it was an external force not relating to the app switcher. We were also curious whether participants felt inclined to go onto social media after reading.
Intervention Study Results: [Results linked here]
- Most participants logged reading sessions over the four day period rather than reading obstructions
- Most participants recorded reading in the morning or in the evening, right after dinner
- Half of the participants were motivated to read because of our pseudo app switcher, i.e. they opened a social media app and were reminded to switch out, which prompted them to read instead
- The biggest motivation to read was to complete class readings
- Half of the participants were inclined to use social media after
- There was no clear preference for digital over physical mediums or vice versa
- The vast majority of obstructions recorded were due to participants getting “sucked into” their phones by checking their phone first thing in the morning or opening TikTok
- Another big cause of obstructions was having too much homework or, relatedly, being too tired at the end of the day to want to read
Implications for our design:
The results of our study support our intervention idea of an app switcher. Because most people report getting distracted by their phones, phone usage seems like an appropriate area in which we can intervene. The simulated app switcher used in our study is, of course, much less effective than an actual implementation on one’s phone because our intervention demanded that participants recall the existence of an app switcher on their phone. We would then expect our app to be even more effective at accomplishing its goals.
We were inspired by the results of the intervention study to think of more ways to encourage participants to read. We noticed that every participant recorded reading through some digital medium at least once during the study. After discussing this, we decided that we would implement a feature that allows a user to pick some digital reading applications on their phone so that when the app switcher takes them away from a social media app, they can fluidly switch to some other reading-based app on their phone (NYT, the New Yorker, Books, etc…). They could also opt for a physical medium. This feature would be customizable to the user and would minimize the amount of friction required to start reading.
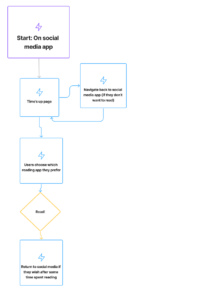
System Paths
For our two personas, Data Driven Dave (DDD) and Find a Better Book Brooke (FBBB), we drew out system paths to illustrate how each one might navigate our app. Data Driven Dave wants to read to gain more knowledge whereas Find a Better Book Brooke wants to read more but finds that she gets easily distracted by her phone.
The purpose of our system path was to understand how different users with different needs would navigate the same app. Because their motivations and desires are unique, they will likely find their own paths through the app, and it was important for us to illustrate these different paths to understand how we could best serve our different users.

We first began drawing the path for FBBB. Because she gets easily distracted, we assumed she would enter our app through the app switcher, i.e. she would open TikTok, the app switcher would activate, pulling her away from TikTok and encouraging her to read. FBBB is a committed reader, so we assumed her next step would be to set goals. Once her reading goals are set, she would begin reading and our app’s timer would start. At this point, she would no longer be in the system circle, though we did not draw this as to avoid confusion.
When we began drawing DDD’s path, we noticed that he would have many converging touch points with FBBB. In fact, once he is in the app, his path through it would be nearly identical to FBBB’s in setting goals and starting to read. However, he would enter the app from a notification on his phone, like a widget.
We decided to think more about points where our personas would diverge. We went about expanding our system paths by including exceptions or specific use cases to each of our personas as an extension of converging points (with sticky notes). For example, although goal setting was a point of convergence for our two personas, areas where they would differ include wanting to possibly edit their goals after they’ve already set them. Or, for a user like FBBB who may be unsure of her reading goals, perhaps she’d benefit from preset goals that align to her specific needs. Or, perhaps our two personas want to customize the strictness of the app switching functionality.
The system path allowed us to think about both core functionalities (i.e. goal setting) and edge cases for specific users. These takeaways would inform the design of our app.
Story Maps
Once we were able to outline the various system flows for our personas to get a better sense of how each would flow through our app, we focused on DDD and how he might interact with key features.

Our high level functions include login/registration, setting of reading goals, customizing potential reading apps to switch to, and the app switcher itself. These goals were defined by our system path because they were common touch points for our two personas. Our login and registration steps are quite similar to existing platforms. Our other activities, though, cater to a user’s personal goals. Goal setting would require the user to define their goals, their preferred time of day to read, how much time they want to spend reading, and how strict the app switching functionalist should be.
Implications:
We realized that our goal for the story map is to ensure we introduce very little friction in our app, since having too many requirements may sway the user away from the app. As such, we wanted our design to be incredibly stripped back and simple, with only KEY features present.
When we created our story map, one of our biggest concerns was how to hold users accountable to their goals. We wanted to make our app sticker, so we realized that some gamification elements might be useful/necessary. We may want to focus on time/progress tracking features or add streaks and achievements to promote stickiness.
MVP Features
From our storyboarding, intervention study, system baths and story map, we were able to come up with MVP features. We split these features in alpha features, or absolute must-haves, and beta features, which are important and desired but not absolutely necessary for our app. Below are a list of such features:
Alpha:
- Login/Registration
- Email registration
- Registration includes an on boarding where users can outline their goals and preferences. These can later be altered in settings.
- Profile and Settings
- Settings will likely be embedded in the profile
- Users can adjust customizable goals like how often they want to read, time of day to read, type of media, notifications on/off, strictness of app switch functionality
- Progress tracking
- Visualization to understand progress and goal attainment over certain periods of time
- App switching functionality: when a user opens up another app or is on an app for too long, our app will switch them out and require them to read for a certain amount of time, blocking the app they had been on in the process
- Prevents a user from reaccessing the app they were using while the timer is going
- Ability to log a reading session in the app
Beta:
- Notifications toggle (nested in settings)
- A “spotify wrapped” like feature that sums up a month’s worth of reading
- Customizable feature that allows users to pick certain apps to switch too (reading based apps like NYT, the New Yorker, etc…) so that when the app switcher becomes active, they can seamlessly switch to a reading-based app
Bubble Map
Using all the methods above and regarding our list of MVP features, we created a bubble map to outline the relationships between features, personas, and goals. This allowed us to weight certain features and determine what primary features vs secondary features should be.

We synthesized our individual bubble maps by identifying common themes present in all our diagrams, which ended up being the “app switcher” functionality, and the “home” page. Since those are two distinct ways the user interacts with the app, we took those as the 2 main building blocks of our synthesized bubble diagram. The key insight from this step, which echoed insights from our previous steps, was that our app has 2 distinct pathways for user interaction, and thus has 2 different entry points that result in different goals and outcomes.
From there, we added on the sub-bubble of “goals” and “registration/log in” to the “home” page. For our “app switcher”, our individual bubble maps showed that there is a cyclical nature to that functionality, which we reflected in the synthesis. This is also where the connection to other apps happens, cycling between the vice of choice (tiktok, instagram, candy crush) and the reading material customized by the user.
Our bubble map diagram utilizes color to denote categories and and size to denote the amount of time the user spends in each bubble/screen. As such, our hope is that the “app switcher” contains the most time spent. After looking over our feedback from previous assignments and our in-class discussions with the teaching team, we also explicitly added the “emergency exit” sub-bubble to the “app switcher”. We hope that this accounts for very little use, hence the bubble size, but it is a necessary feature to conserve the user’s agency.
The bubble map was instrumental in helping us understand how information flows and, therefore, in building our prototype.
Interaction Design
Flow 1: Sign Up/Log in
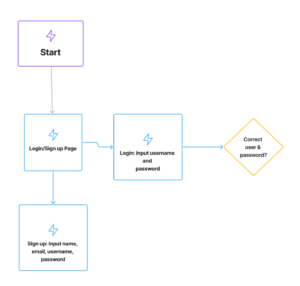
These wireflows implement a simple and intuitive flow so there are no extraneous screens or buttons that might confuse a user. This entails a page for registration, a login page, and a mechanism for checking whether the login is correct. If so, the flow continues to the homescreen, if not, an error message will occur.
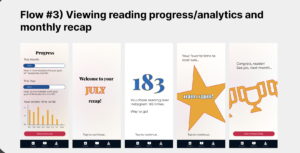
Flow 2: Progress

There are two main features to be outlined here. One is an overall progress display that will likely take the form of a graph but with some customizable features so that users can control how they view and interpret their own reading progress over time. We also included a feature that is inspired by “spotify wrapped” in that, if users want, they can view their reading statistics for the last month. Once they choose to do so, they will click or swipe through the following screens until the recap is complete.
Flow 3: App Switch
The first screen shows a user on another app. Our app tracks social media usage and alerts the user when they’ve spent excessive time on it, prompting them to read instead. If they ignore the alert and return to social media, the app will repeatedly trigger the timer and alarm, making uninterrupted browsing impossible. When redirected to our app, users can switch to a reading app (e.g., NYT, The New Yorker) or log non-digital reading. After a user-set duration, they can return to social media if desired.
Sketchy Screens (Low-Fidelity)

In our sketchy screens, we aimed for clarity, efficiency, and minimal distractions. Mapping them out helped us identify key improvements: navigation needed to be more intuitive with clearer back buttons and fewer tap-throughs, while registration required all inputs on a single page to reduce friction. We debated whether to integrate the timer subtly into the home screen or keep it separate. Additionally, elements like the plus-sign button, bullet points, and icons needed clearer explanations. From these insights, we refined navigation flows while preserving the clean layout and white space to enhance user control and reduce confusion.
Moodboard
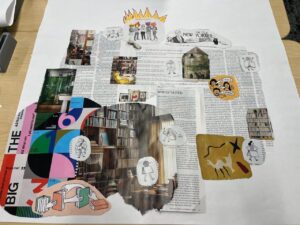
Our synthesized moodboard was a collaborative effort in class, where we each selected and assembled scraps from magazines, cutting or tearing them out before gluing them together. What makes this moodboard unique is how it reflects our individual perspectives while tying together our sketches and ideas. The magazines we prioritized, mainly bold, artistic, and text-heavy pieces from The New Yorker, set the foundation. One member used text as an artistic backdrop, reflecting the vintage atmosphere of reading. Another chose bold, colorful images and cartoon sketches, and a third focused on realistic photos capturing a cozy, book-filled evening. Despite these differences, we balanced each style, creating a moodboard that felt cohesive. The result embodies the essence of our app: diverse (blending modern, vintage, and classic elements), enriching (with clusters of text, particularly inspired by The New Yorker), and warm (a welcoming invitation to settle in with a good book).
Style Tile
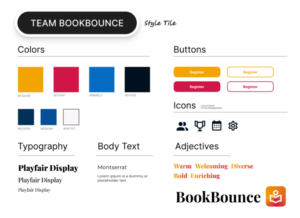
Our team chose the style above based on key elements from our synthesized moodboard. The color palette features warm tones contrasted with darker shades, adding boldness to the brand, as seen in the logo on the bottom right. Our typography blends modern and antique elements from the moodboard, using Playfair Display for headings and Montserrat for body text. This combination emphasizes the literary feel while maintaining a “new tech” edge with its readability and clean lines. Throughout our brainstorming, we’ve focused on aesthetics and ambiance over clutter or complexity, which will be a key differentiator for our app. This approach is reflected in the design with clear, bold lines and colors, rather than muted, antique tones. For the home screen, we envisioned ambient light effects, like candles or floating bubbles, to invite users to sit back, relax, and enjoy a good read.
Prototype + Usability Testing
For usability testing, we made our first clickable prototype, which includes functional screens for most MVP features and stationary screens for the beta features. We focused on our test on four main flows, which include 1) completing the onboarding (goal setting) and registration, 2) navigating the home page and starting a reading session 3) editing profile settings, and 4) reviewing reading progress and analytics. Our leading questions for this test focused on general placement and usability of components, the similarities between our theme and the color/design, and how well the user is able to complete each task. The main flows are shown below:

We had many takeaways from our first clickable prototype, dividing the issues into severe, moderate, and minor fixes. Users faced several issues with the app’s design. Severe issues included a lack of clear visual hierarchy, particularly on the progress page and profile, where clutter made it hard to focus. To address this, we wanted to reduce card usage, emphasize key elements with size and spacing, and incorporate more white space. Additionally, users were confused about what a reading session is and how progress is tracked. To improve this, we planned to enhance the onboarding process, add tooltips, and clarify how progress is logged. Users also desired more immediate feedback on their reading progress, so we planned to display specific books and articles read and improve progress indicators beyond abstract stats.
Moderate issues included the placement and size of the call-to-action button, which wasn’t prominent enough or well-positioned. We believe it helps to center the button, increase its size, and swap its position with the streak tracker. Font size and readability were also concerns, particularly with small text for time options and difficulty labels. To improve readability, we increased font sizes and contrast in key areas. Finally, minor UI tweaks, such as removing hover effects on mobile, adding an “X” to remove blocked apps, and adjusting button/text sizes for consistency, refine the layout. Terminology changes, such as replacing “screen time” with “reading time,” are also planned to improve clarity.
Final Prototype and Revisions
Our final Figma prototype can be found here: BookBounce Final Prototype. This final iteration includes functional flows of each of our 5 MVP features (Onboarding/registration, profile/settings, progress tracking, app switching functionality, and logging a reading session), which includes two new flows for adjusting profile settings and viewing past reads, which were previously only screens. In addition, we have now included each beta MVP feature (notifications, “reading wrapped”, choosing apps to switch to) in the screens. All final MVP flows are captured below, along with how they incorporated feedback from usability testing:
1) Onboarding and Registration
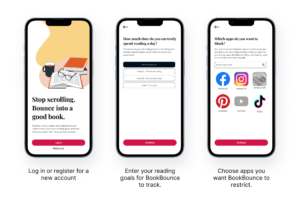
- Main issue addressed: Improved text size and app selection process.
- Modifications: Previously, each user interaction for choosing goals or preferences during the onboarding process were similar – the copy and paste multiple choice selection with columns of horizontal bars.
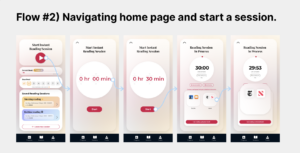
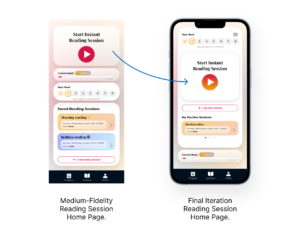
2) Start an instant reading session and experience the app switch functionality.

- Main issue addressed: Severe Issues – lack of clear visual hierarchy and too much clutter. Moderate Issues – call to action button placement isn’t prominent, font size and readability of text and easy/medium/hard labels.
- Modifications: For our final iteration, we redesigned the main session home page addressing both severe and moderate issues in its visual hierarchy. We removed elements that were previously separated and nested and brought attention to the call to action “play” button by centering it in the middle of the screen and making use of white space to emphasize its importance.
3) Log a reading session and preview past reads through the reading calendar.
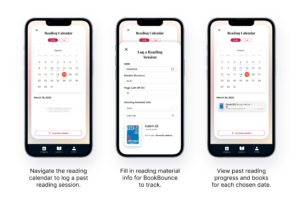
- Main issue addressed: Severe Issues: Users unsure how progress is logged, users wanted to preview past books they’ve read.
- Modifications: This was a new flow added to address a frequent issue of users wanting clarity on how to log a reading session, along with wanting to log specific books they’ve read. We decided on a separate reading calendar accessible from the home page to show immediate book progress, which exists outside of the progress analytics since we want to bring more attention to specific readings from the past that can be accessible – the progress analytics page wouldn’t be able to provide enough detail. However, reading time/page progress would still be kept track of in the main analytics page, but the calendar allows the reader to visualize their reading streaks by month/year.
4) Edit profile settings and reading preferences/goals.

- Main issue addressed: Severe Issues: Lack of clear visual hierarchy in profile screen and a desire for reduced car usage to emphasize key elements. Moderate Issues: Font size and readability, with text and input options being too small. Minor UI Tweaks: Need a way to remove blocked apps (add red X’s).
- Modifications: We did a complete redesign of the profile/settings page to address the issue of unclear visual hierarchy and excessive clutter by doing what our users kept quoting – use white space! We increased the font size and brought attention to four separate categories our users may want to edit. Clicking on each category now shoes enlarged user input options, which was a moderate issue during usability testing. Additionally, we standardized what text inputs should look like to address a concern that buttons have the same style as text input blocks.

5) View monthly and yearly reading analytics and progress tracking.

- Main issue addressed: Severe Issues: Lack of clear visual hierarchy in progress page, unclear and lack of immediate feedback in progress tracking (users wanted more progress indicators beyond the “wrapped” feature). Trivial Issues: Fixed text discrepancies (ie. “Screen time” instead of “reading time”).
- Modifications: We focused the final iteration for progress tracking on 1) the type of data that a user would want to see and 2) how data should be visualized in a way that is enticing to the user and can nudge them towards completing their goal. We redesigned the reading progress page to include more data in a structured manner, with a bar graph as the main focus to visualize streaks along with two completion graphs per goal to show how close a user could be to achieving it.
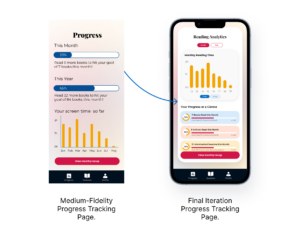
- To address the concern of wanting both immediate and long-term goals, we added buttons for the user to choose whether to view weekly, monthly, or yearly progress. Additionally, for a greater nudge, we made the data widgets specific to user goals (ie. adding undistracted sessions) and emphasized how much the user has accomplished rather than how much they have left to meet their goal, which was an important phrasing change we made for more effective behavior change.