
1. Take us through your solution ideation (done in 6A – sticky notes -> note cards -> paper concept sketches). Include images and summarize the key solution implementations you explored. Tell us how you decided on which solution implementation to pursue.
We brainstormed several solutions– some of them more out of the box than others.
Of these solutions we picked 23 to sketch on notecards– sunscreen as a service (SaaS), a sunscreen club, and a plant widget.
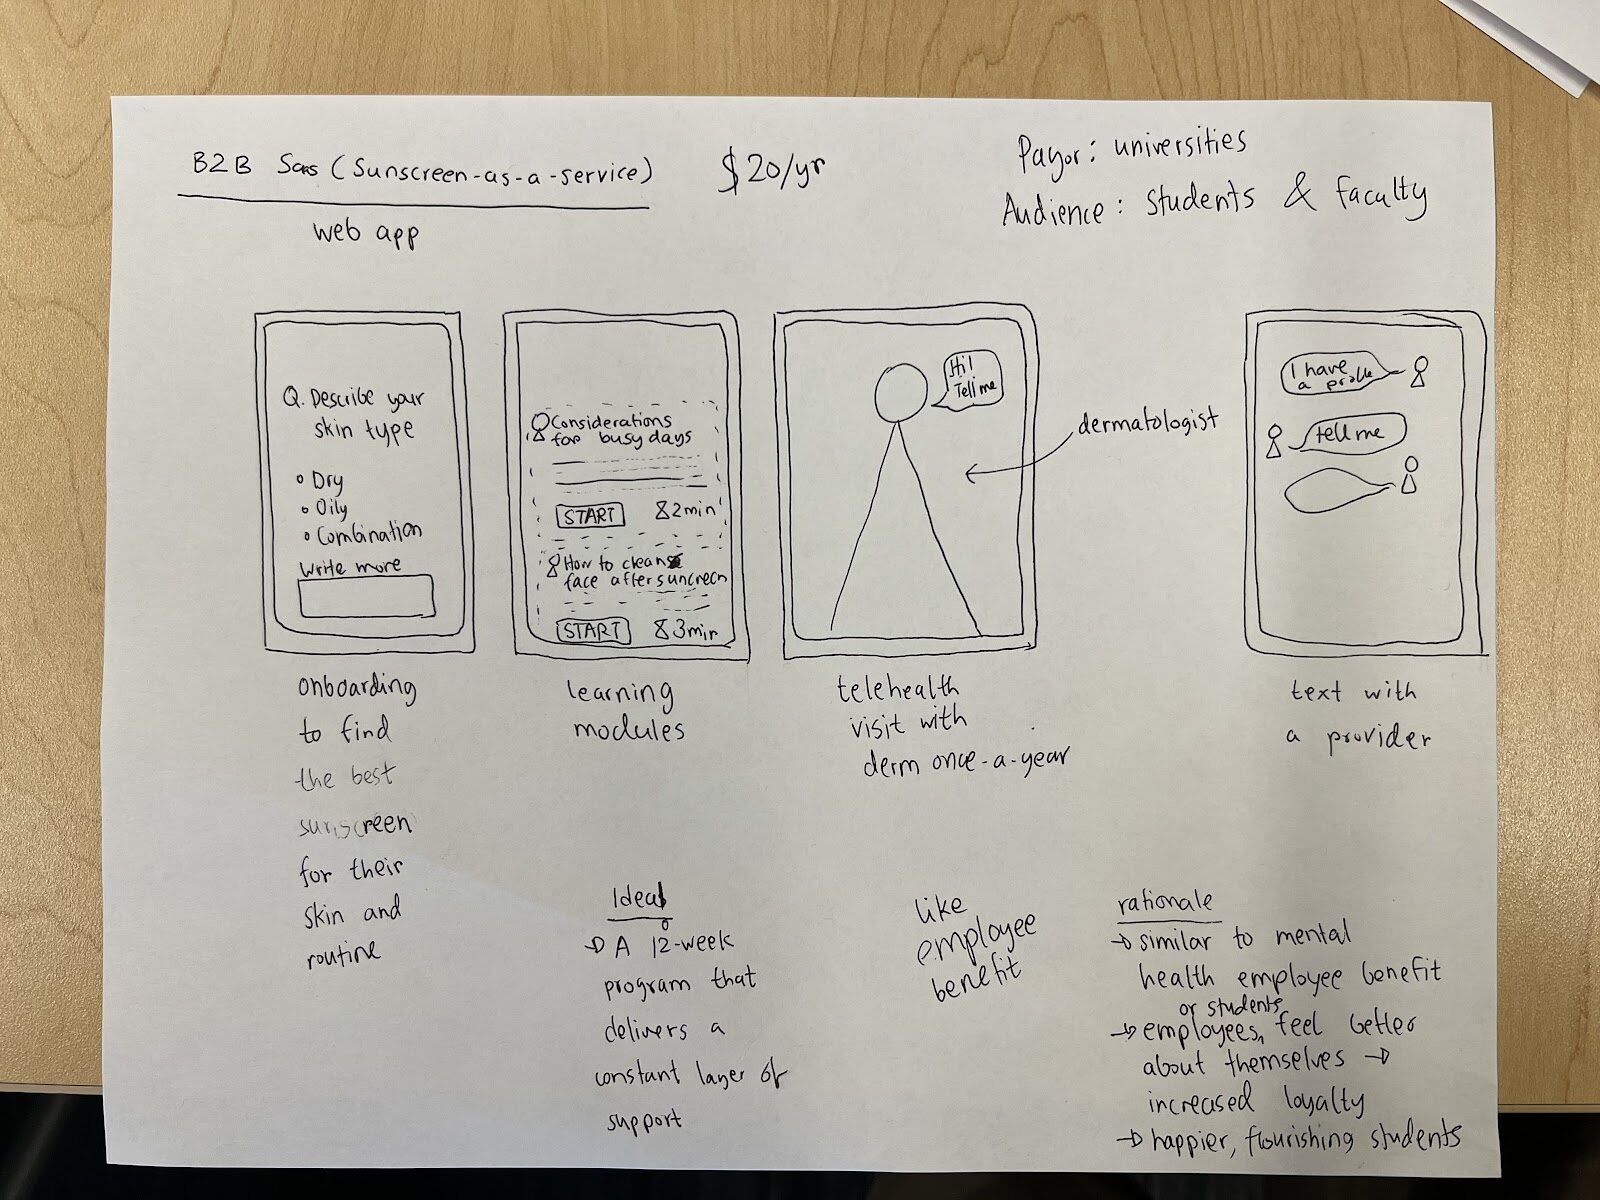
- B2B SaaS (Sunscreen-as-a-Service): In our previous steps, we discovered an issue of sunscreen-related skin problems (both medical and comfort-wise), which gave us the idea for a digital health product. The payor will be universities like Stanford/Stanford-sponsored-insurance and users will be students and employees. Users will then be able to This is a similar model to Meru Health (Stanford is their customer for its employees). There will be an onboarding page whereby users can use a screener to give us information about their skin type and sunscreen use. Then we will have asynchronous learning modules for different personas. There will also be a telehealth component where a clinical provider uses the data from the onboarding and then a conversation (either call or text) with the the user to recommend an appropriate sunscreen and address any related concerns.
- Sunscreen club: In our studies, we noticed that participants were interested in knowing what products other people were using. This led us to coming up with the idea of a sunscreen club, where you can see what sunscreen products your friends use and you can recommend products to others.
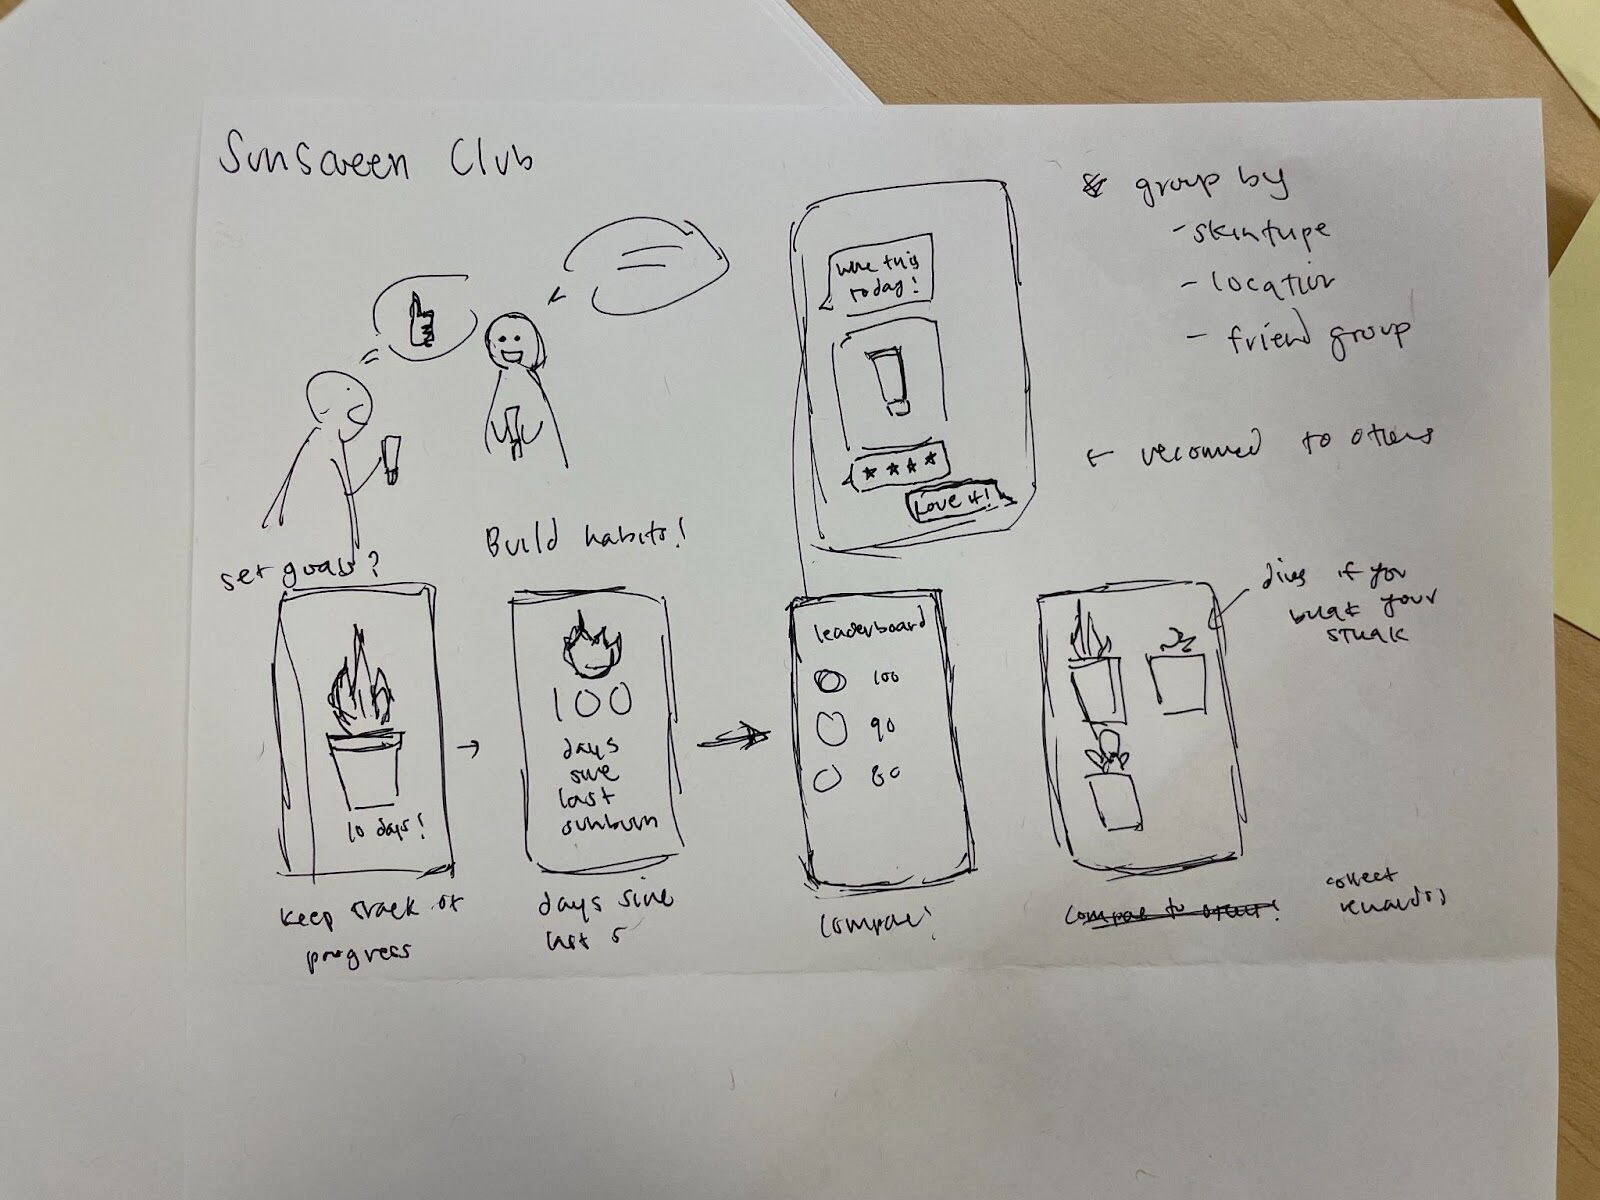
- Plant widget: We noticed that people enjoyed the social aspect of having friends who also put on sunscreen. In addition, a lot of people who didn’t put on sunscreen noted that they didn’t do so because they can’t see the immediate effects of not wearing sunscreen. For the plant widget, the user will have a virtual plant “pet,” and putting on sunscreen everyday will also help protect the plant from wilting. We hope that this shows the effects of not wearing sunscreen more immediately in a lighthearted way. On the widget, you can also see your friends’ plants, to make this experience more social.

We decided to move forward with the plant widget idea, as it tackles two big insights we gained from our research: people want to see more immediate effects of not wearing sunscreen, and people feel more motivated to keep up this habit if their friends are also. Some specific features we were thinking about for our solution include:
- A widget that displays your plant and your friends’
- An app where you log if you put on sunscreen for the day – can see friends’ plants in depth
- Tapping on a friend’s plant allows you to see what sunscreen they own
- A reminder feature in the app to be able to remind friends
- If you didn’t wear sunscreen for a day, your plant would wilt a bit
2. Look at your solution and map what is feasible, desirable, and viable. Take all the information from your diagram and place it a 2×2 with important to unimportant and known to unknown. Include an image of your assumption map and highlight which one’s are the most crucial to your team’s solution.
Link to assumption map: https://www.figma.com/file/u1evKlmzCEtf3qMxhYWSHf/6B-Assumptions-Mapping?node-id=1%3A152&t=mwEBhExteK5NWJWh-1

3. Take 2-3 significant assumptions from the important and unknown quadrant and pick a test for each of these assumptions
- People care about how their friends sunscreen habits are doing
- People have investment in a digital plant
- People will return to giving widgets attention day after day
Test Card 1
Test name: Friend Care
Step 1: We believe that people care about seeing how their friends sunscreen habits are doing (critical score: 3/3)
Step 2: To verify that we will, will conduct research in the form of contextual inquiry. (test cost 1/3 & data reliability 2/3)
Step 3: And measure how people interact socially and how often they inquire about their friends. (time required: 2/3)
Step 4: We are right if people check on their friend’s habits daily, and if they also put sunscreen on that day.
Test Card 2
Test name: Digital Investment
Step 1: We believe that people have personal investment in a digital plant (critical score: 2/3)
Step 2: To verify that we will, do a smoke test of plant caricatures (test cost 2/3 & data reliability 3/3)
Step 3: And measure how often people check their plant, how much time they spend looking at their plant, their emotional response when before and after being shown the plant, how they talk about the plant. (time required: 2/3)
Step 4: We are right if people check on the plant and if they have a positive emotional response.
Test Card 3
Test name: Widget Consistency
Step 1: We believe that people will return to giving widgets attention day after day. (Critical score: 2/3)
Step 2: To verify this we plan on creating mental models to understand one’s thought process of accessing a widget consistently. (test cost 2/3 & data reliability 2/3)
Step 3: And measure how often a user returns to the widget, measure how long they interact with the widget, see exactly what they are doing on the widget and if it differs from the last time they accessed it. (time required: 3/3)
Step 4: We are right if users continuously return to the widget and interact with it in a way that is positively helping them with the habit of putting on sunscreen.
Comments
Comments are closed.