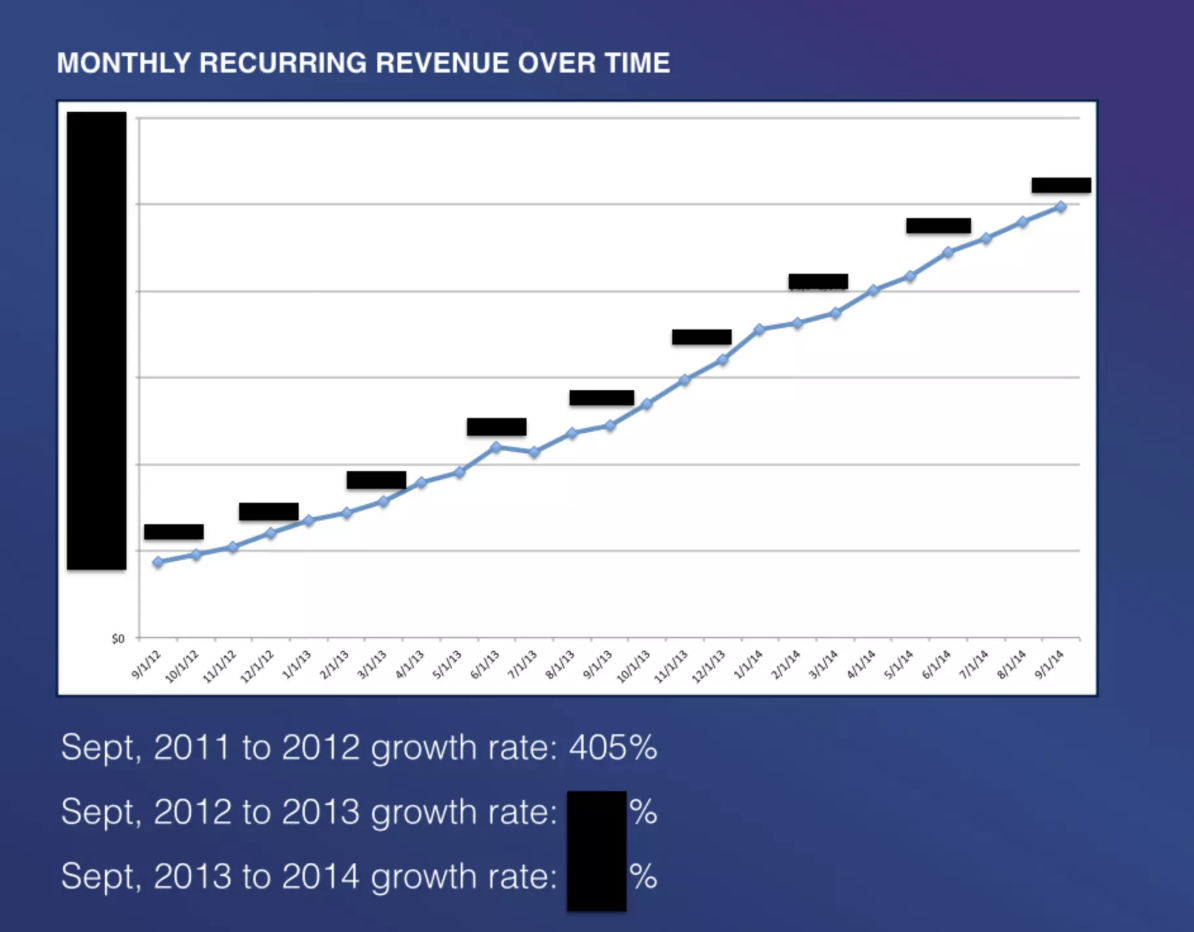
The evidence shows up later, as revenue. Slide 7 charts monthly recurring revenue climbing steadily from 2012 to 2014, after 405% growth from 2011 to 2012. Slide 8 adds sales numbers: about six months to earn back the cost of a sale, and a plan to grow from 5 to 33 sales reps in 2014. Despite the redactions, the curve shows customers keep paying.

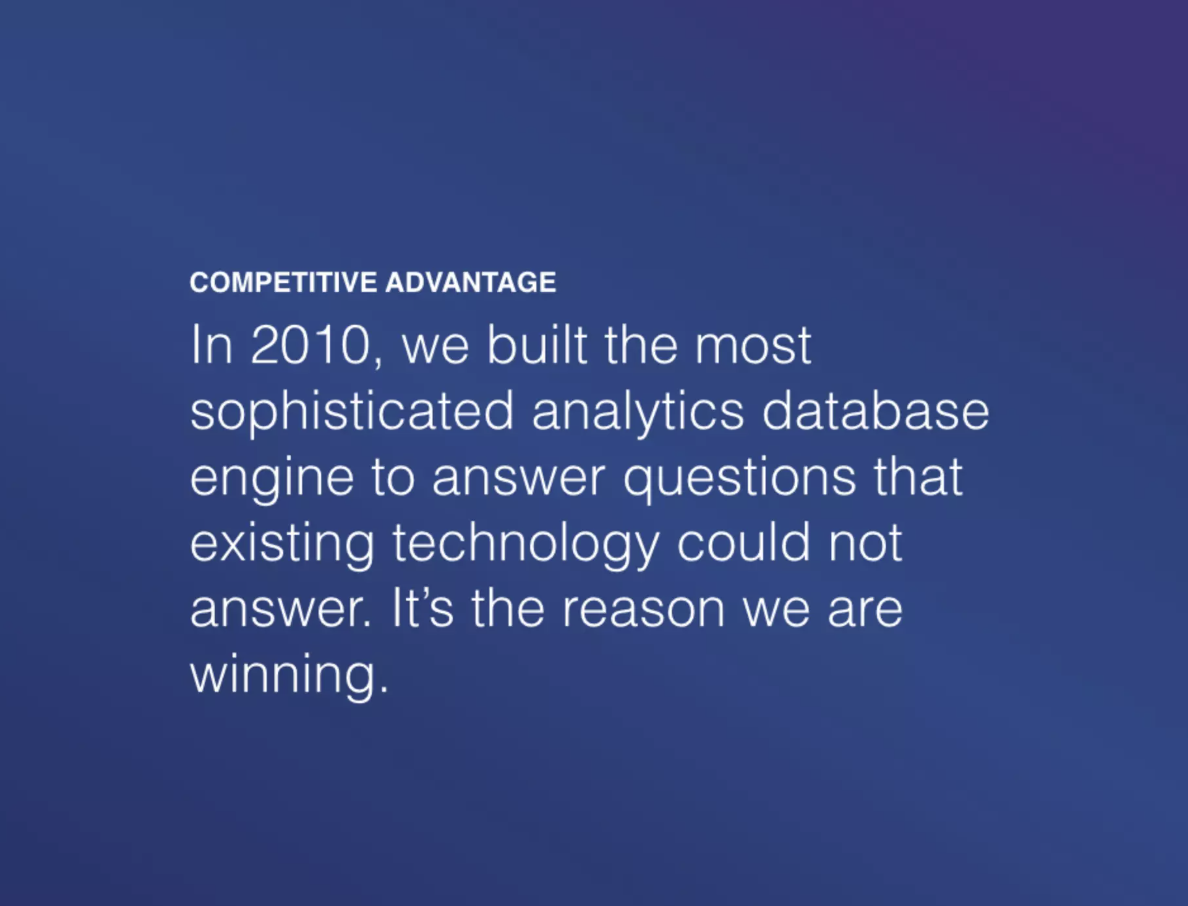
Market size is the biggest gap, because there’s no market slide (as far as I can tell). Slide 4 says Mixpanel will expand from product and marketing into sales and finance, which hints at a big market without putting a number on it. An investor would ask how many companies buy analytics and what they spend. They’d also push on slide 6, which credits a 2010 database engine as “the reason we are winning.” What stops free Google Analytics from catching up? And with churn blacked out, is the revenue sticking?
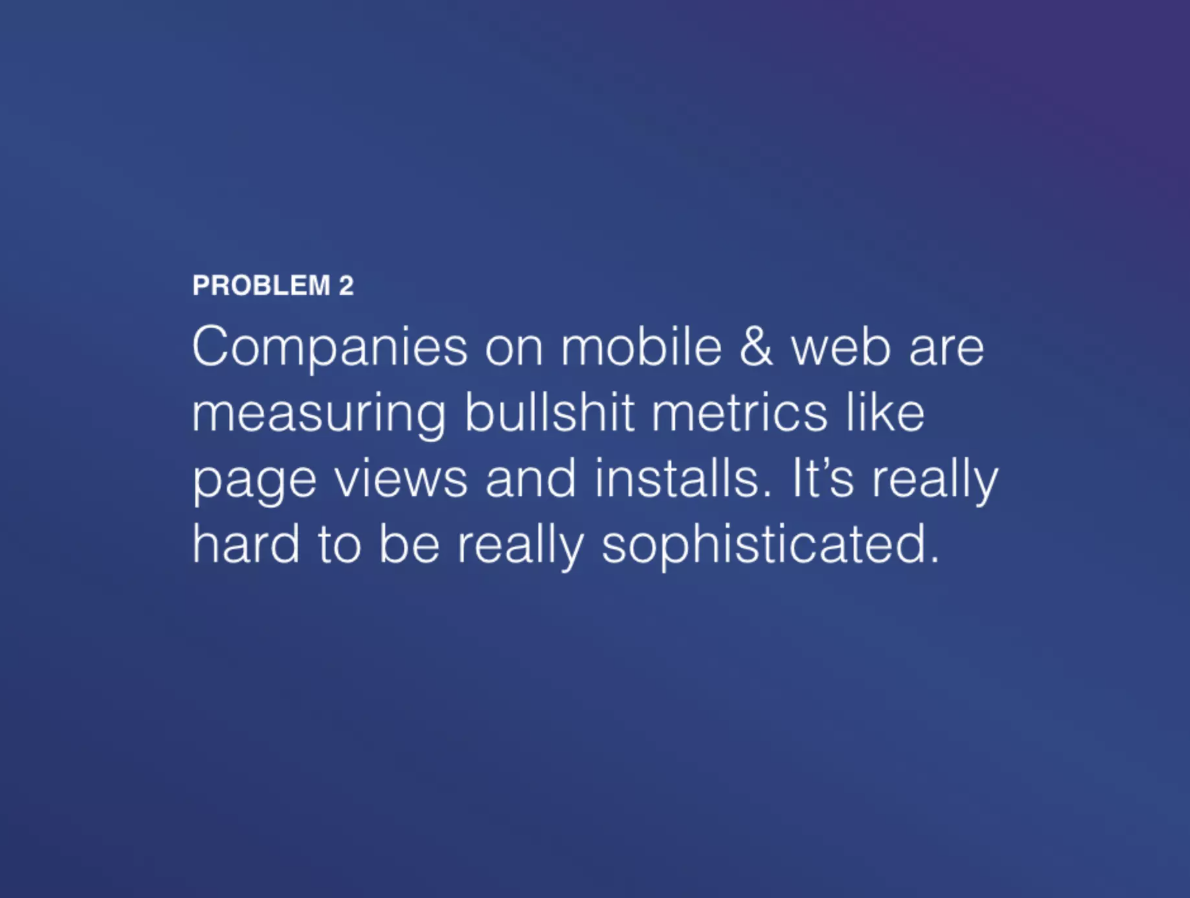
For my Sanity Check pitch, I’m stealing two things. The first is the one-idea slide: a small label, then one plain sentence, so the audience can’t miss the point. The second is the competition 2×2 on slide 11, which sorts rivals by free versus paid and startup versus incumbent. Unlike Mixpanel, though, I’ll back my problem with a real user and a number.