Intervention Study Overview
System Paths
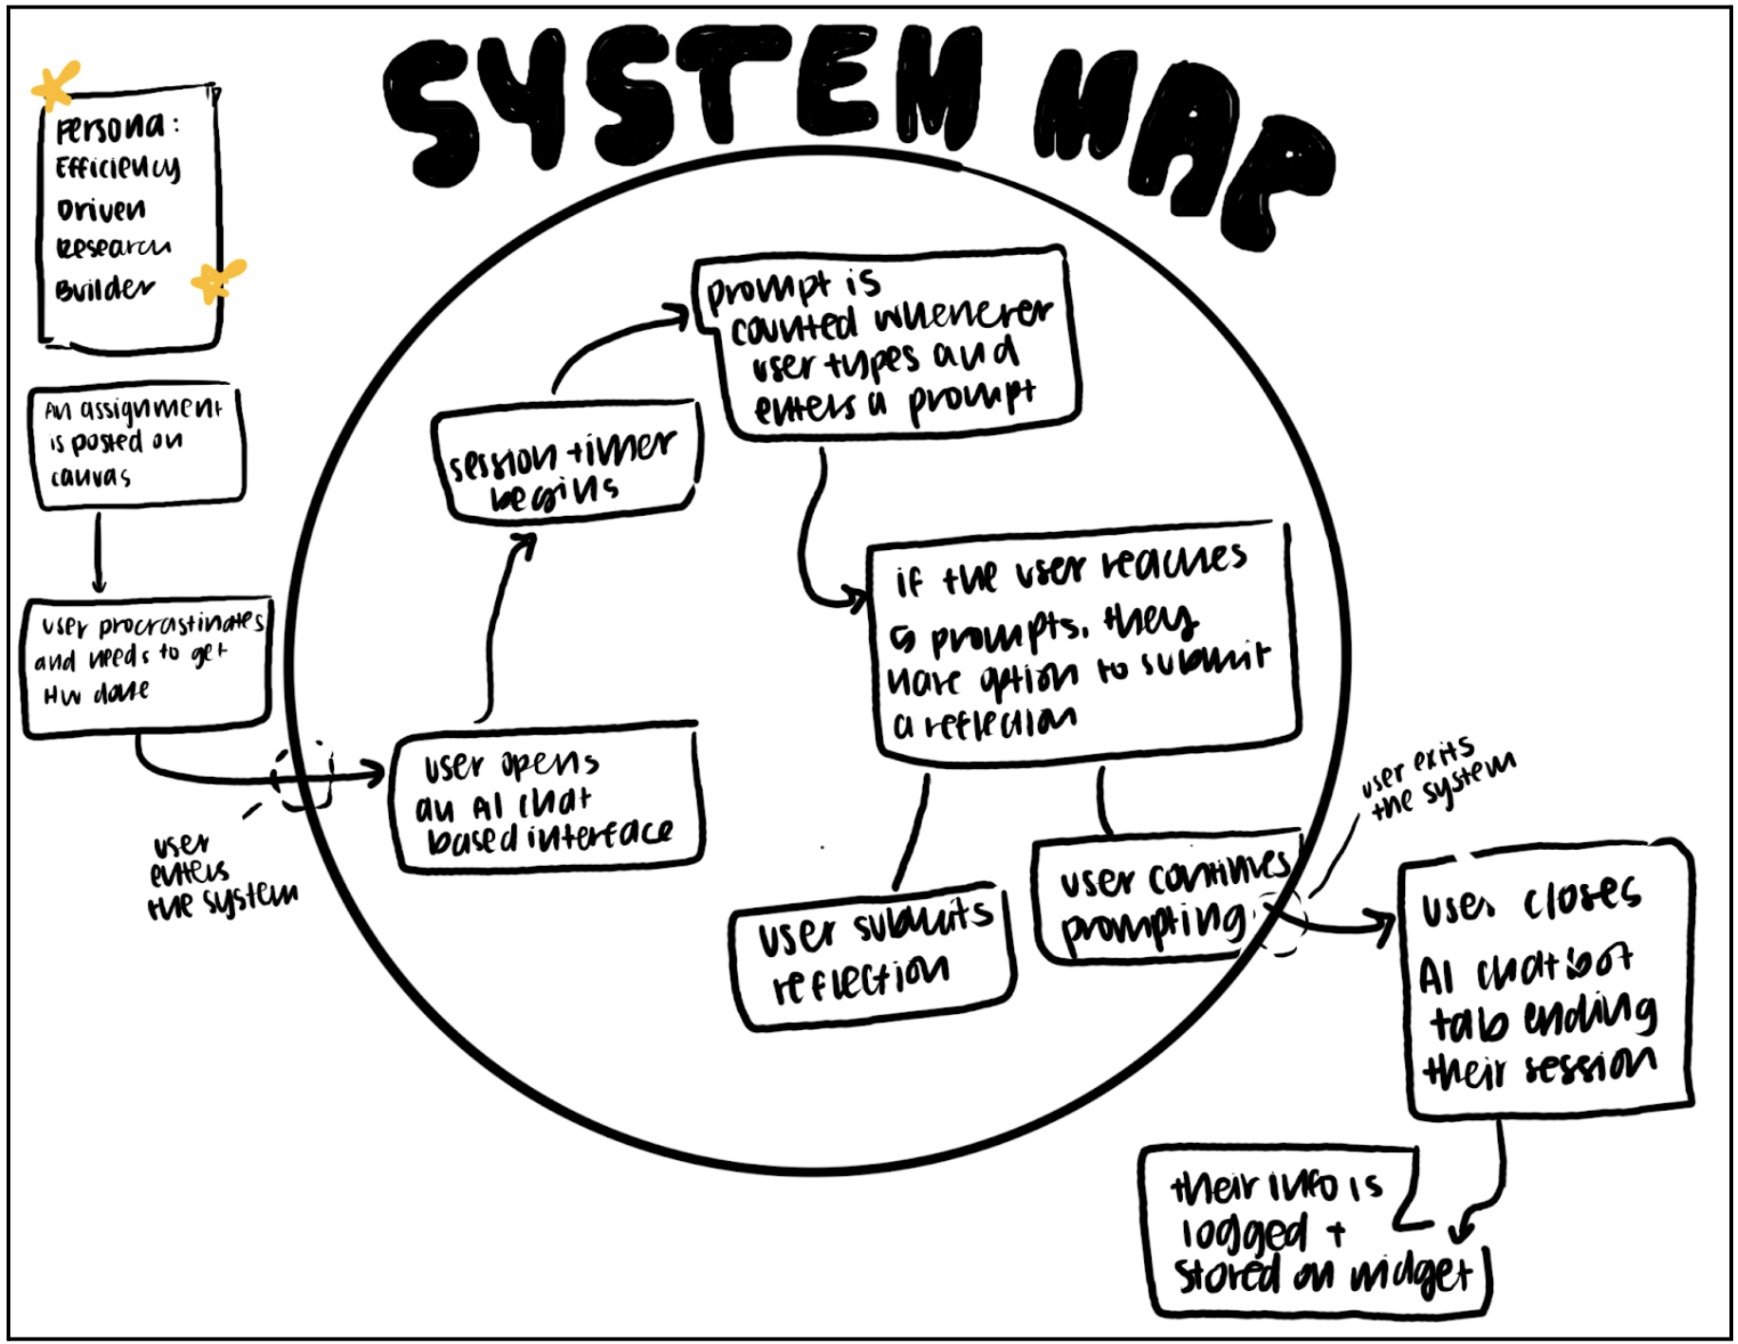
System Map Overview
Our system map was designed for the persona of the efficiency-driven research builder. This user is typically triggered by an external demand such as a Canvas assignment, research deliverable, or looming deadline. Often there is a moment of procrastination or pressure before they begin. The system begins the moment they open an AI browser. At that point, the session timer starts automatically, and prompts are counted and logged each time the user submits one.
If the user reaches five prompts, they are given the option to submit a reflection. This is not mandatory. They can either reflect or continue prompting. The system ends when the user closes the browser. At that point, usage data is stored within the widget. Users can also tap the widget at any time to view aggregate insights, which briefly re-engages them with the system without fully interrupting their workflow.
Key Insights
Mapping the system clarified that our intervention must be largely passive. The user enters the system naturally through their existing AI behavior. We are not asking them to start something new. We are layering awareness onto behavior that already exists. This insight reinforced that friction must be minimal and that reflection opportunities should feel optional rather than enforced.
We also realized that the most meaningful intervention points are moments of escalation, such as reaching a high number of prompts. Rather than interrupting constantly, the system should surface nudges when behavior crosses a threshold. This insight directly shaped our decision to trigger reflections and nudges based on prompt count rather than time intervals alone.
Finally, the system map made clear that entry and exit are not formal. Users move in and out fluidly by opening and closing AI tools. Because of this, the product must capture value in short sessions and provide aggregate insight over time. This reinforced the importance of dashboards and summaries rather than deep in-session engagement.
These insights directly shaped our MVP. Because users naturally enter the system by opening AI in their browser, we built a Chrome Extension with secure login and passive tracking that automatically detects supported AI sites, tracks time spent, and counts prompts without requiring manual input. To keep friction minimal, we included a simple Daily Usage Dashboard with a visual resource meter that shows time and prompt count at a glance, along with customizable daily goals. Instead of constant interruptions, we implemented real-time nudges only when users approach or exceed their limits. Finally, recognizing that reflection should feel lightweight and optional, we added an end-of-day summary with a brief reflection prompt and optional study feedback to encourage awareness without disrupting workflow.
Story Maps
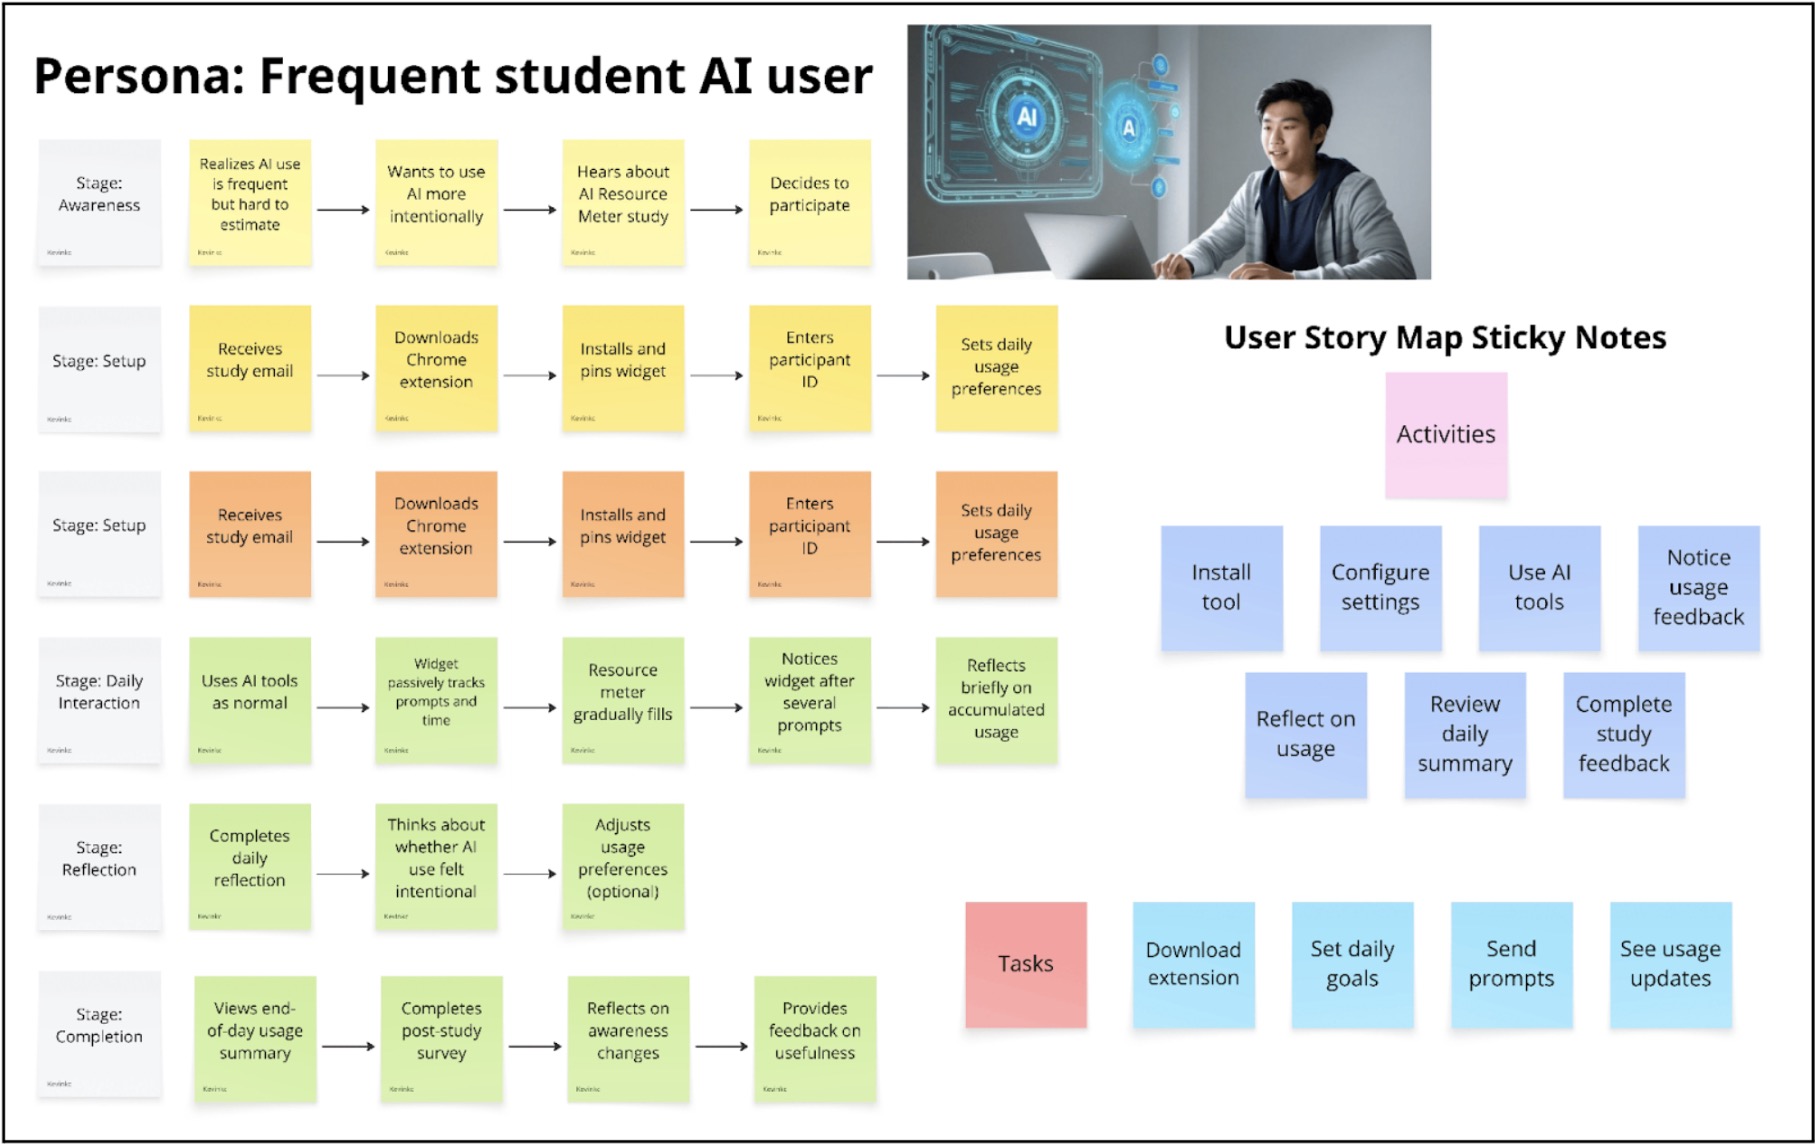
We developed our story map around our primary persona: the frequent student AI user. Instead of starting with features, we mapped the user’s daily journey to understand where meaningful intervention could occur. At the top of the story map, we outlined a timeline of key stages: installation and setup, configuring intentions, using AI throughout the day, noticing usage feedback, reflecting, and completing study feedback. We focused especially on three critical moments: when the user first installs the tool, when they are actively using AI during study sessions, and when they reflect at the end of the day.
For each stage, we asked what problems the user might experience, what their ideal outcome would be, and what lightweight intervention could help them reach that outcome. A major insight from this process was that the core problem is not necessarily overuse of AI, but invisibility. Students struggle to accurately estimate how much they rely on AI tools throughout the day. This led us to prioritize passive tracking over restrictive controls. We also realized that any intervention must not interrupt workflow. Frequent AI users depend on these tools for productivity, so blocking access or requiring manual input would create friction and resistance. Instead, subtle feedback and reflection mechanisms felt more aligned with the user’s needs.
Another key insight was that reflection is more powerful than restriction. The most meaningful behavioral change happens after awareness is built. This directly informed our decision to include an end-of-day summary and a brief reflection prompt. Finally, we recognized that setup must be frictionless; if onboarding is too complex, users will not adopt the tool. This led us to design a simple flow: install the extension, enter a participant ID, and optionally set a daily usage goal.
Each of our MVP features maps directly back to the story map. The Chrome extension and login support the installation stage. Passive usage tracking addresses the invisibility problem during daily AI use. Goal setting supports intentional configuration. The resource meter and real-time nudges correspond to the “notice usage” moment. The end-of-day summary and reflection prompt emerge from the review stage. By grounding every feature in a specific moment in the user journey, the story map prevented feature bloat and ensured our MVP remained focused, lightweight, and behaviorally intentional.
MVP Features
- Chrome Extension
- Install extension
- Secure participant login
- Passive AI Usage Tracking
- Track time spent on AI tools
- Track number of prompts
- Auto-detect supported AI sites
- Daily Usage Dashboard
- Visual “resource meter”
- Shows time + prompt count
- Progress toward daily goal
- Daily Goal Setting
- Set time or prompt limit
- Editable preferences
- Real-Time Nudges
- Notification when nearing/exceeding goal
- End-of-Day Summary
- Daily recap of usage
- 1–2 question reflection prompt
- Study Feedback
- Post-study survey link
- Optional usefulness feedback
Bubble Maps
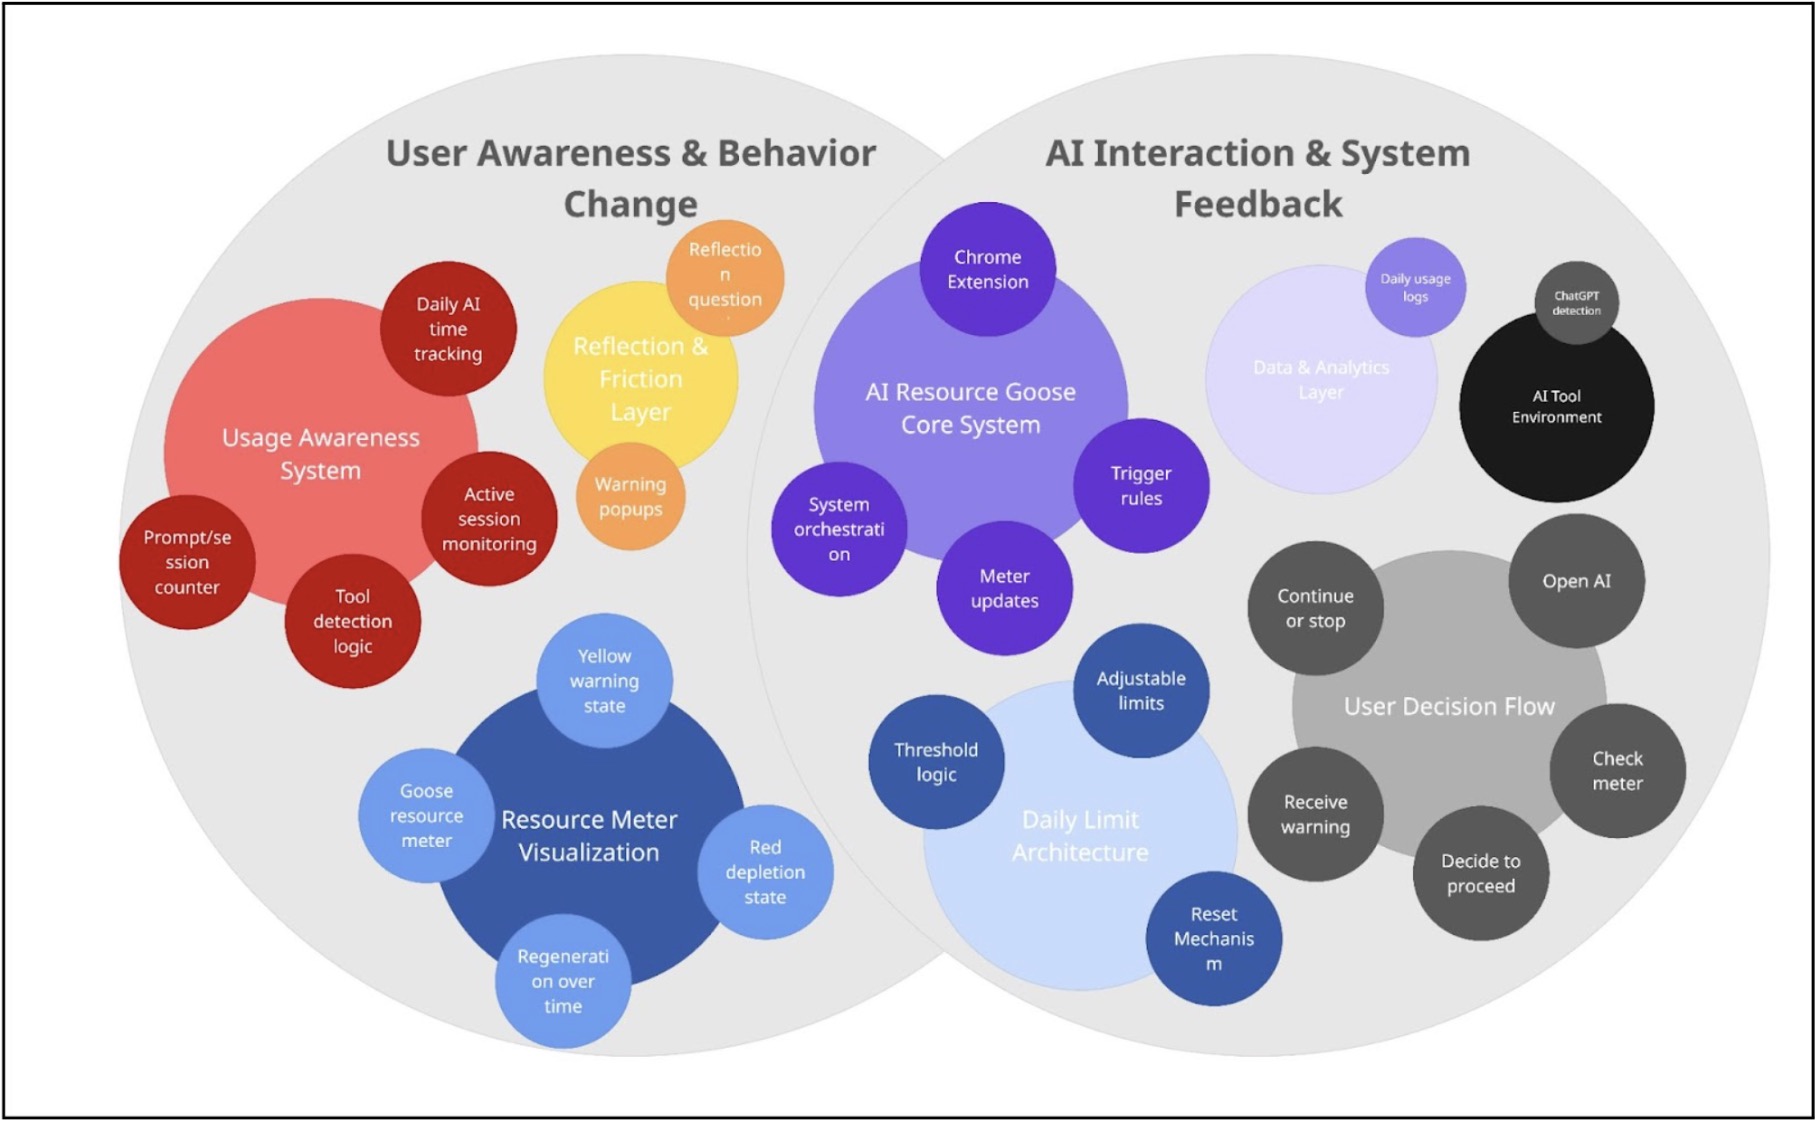
Creating this bubble map helped us see AI Resource Goose as two interconnected systems: User Awareness & Behavior Change and AI Interaction & System Feedback. On the left side, the Usage Awareness System (daily AI time tracking, prompt/session counter, tool detection logic, and active session monitoring) feeds into the Resource Meter Visualization and Reflection & Friction Layer. This clarified that tracking alone is not the intervention—the yellow warning state, red depletion state, warning popups, and reflection questions are what translate data into behavioral friction.
On the right side, mapping the AI Resource Goose Core System, Daily Limit Architecture, and User Decision Flow showed how the system operates through trigger rules, threshold logic, meter updates, and reset mechanisms. The user moves through a clear sequence: open AI → check meter → decide to proceed → receive warning → continue or stop. The Data & Analytics Layer and AI Tool Environment support this loop through detection and daily usage logs.
The bubble sizes helped us identify where the system carries the most weight: the Core System, Usage Awareness System, Resource Meter Visualization, and Daily Limit Architecture are central because they control state changes and user feedback. Overall, the map clarified how tracking, visualization, thresholds, and decision flow work together as one coordinated system rather than isolated features.
Assumption Map
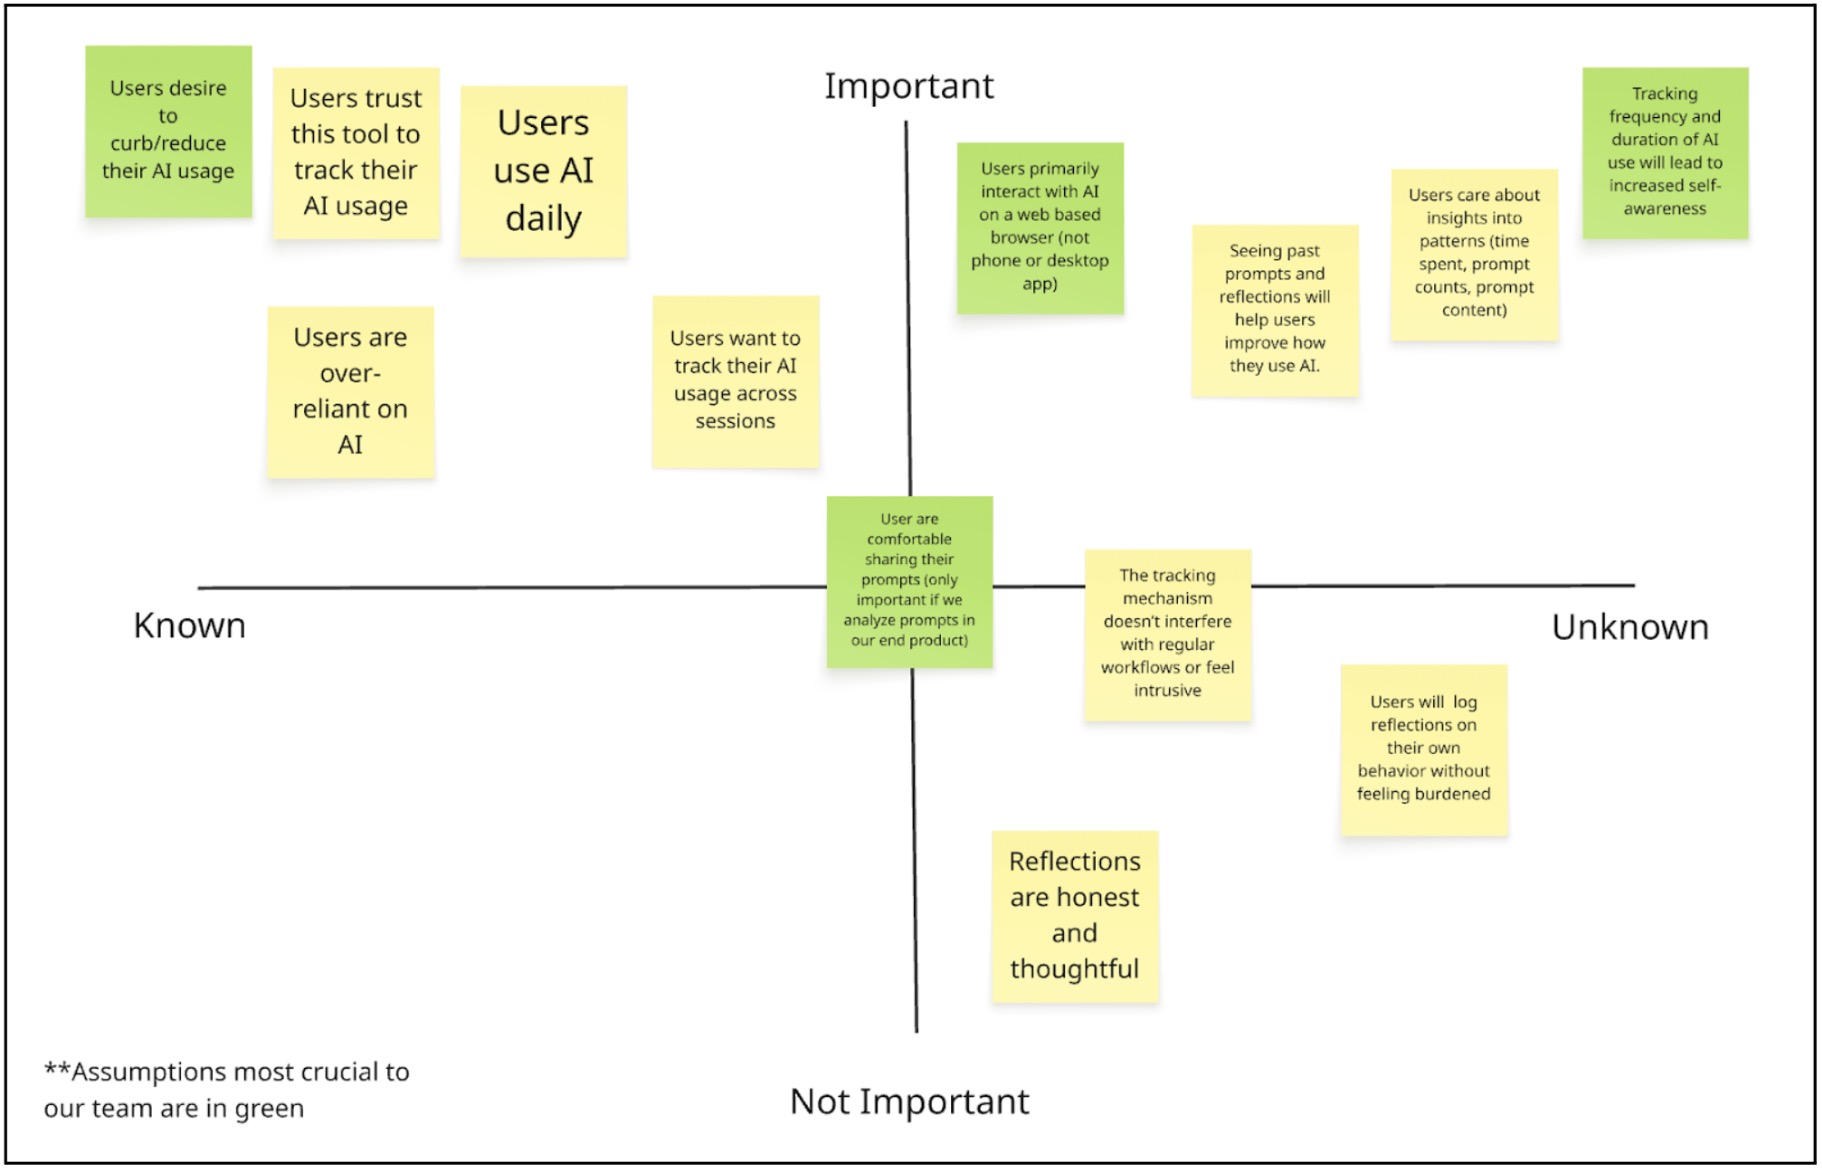
Mapping our assumptions revealed that the biggest risks in our AI intervention are behavioral rather than technical. While building a browser widget that tracks time and prompts is feasible, the success of the product depends on human psychology. Our solution assumes users want greater awareness of their AI habits, are comfortable being monitored, and believe that seeing their data will meaningfully change how they behave. If these assumptions fail, the product loses its core value and becomes just another analytics tool.
One of our most crucial assumptions is that users primarily interact with AI through web-based interfaces. Because our intervention exists as a browser widget, it can only capture meaningful behavior if AI usage happens in that environment. If users primarily rely on desktop apps, IDE integrations, or mobile apps, our tool would not reflect their real usage patterns. This is a foundational infrastructure assumption. If it is wrong, the product cannot function as intended.
Equally critical are our assumptions around trust and behavior change. We are asking users to allow tracking of their prompts and usage patterns, which can feel invasive if not positioned carefully. Without trust, users will not install or consistently use the tool. At the same time, we assume that awareness leads to reflection and more intentional AI use. If seeing usage data does not actually shift behavior, then the intervention fails to deliver meaningful impact. This mapping process made clear that our success depends less on tracking capability and more on perceived safety, seamless integration, and the ability to translate data into genuine self-awareness.
Assumption Tests
Test 1: Web-Based AI Usage
- We believe: Users primarily interact with AI tools through web-based browser interfaces.
- To verify, we will: Survey 50+ AI users (students or professionals) and ask them to estimate the percentage of their AI usage across environments: web browser, desktop app, IDE plugin, or mobile app. We can also ask them to check their browser history or screen time logs to improve accuracy.
- And measure: The percentage of total AI sessions occurring in web browsers.
- Criteria: We are right if
- At least 60–70% of AI interactions occur in web browsers.
- If less than 50% occur in browsers, our widget risks being irrelevant or incomplete.
Test 2: Comfort With Prompt Tracking
- We believe that: Users are comfortable installing a tool that tracks their AI usage, including prompt content.
- To verify, we will: Conduct 5–8 moderated interviews using a simple Figma prototype of the widget. We will clearly explain that the tool tracks time spent, number of prompts, and stores prompt content. We will ask participants whether they would install it and what concerns they have.
- And measure: The percentage of participants who say they would install the tool with no major privacy concerns.
- Criteria: We are right if,
- At least 70% express comfort or conditional comfort with minor adjustments (such as anonymization or local storage).
- If the majority express strong discomfort, our trust assumption is invalid and the product must be redesigned.
Test 3: Tracking Leads to Self-Awareness
- We believe that: Seeing usage data about AI time, prompt frequency, and past prompts increases users’ self-awareness and leads to more intentional AI use.
- To verify, we will: Run a 5-day manual tracking experiment with 10 users. Participants will log how long they use AI and what they use it for. On Day 5, we will present them with a simple dashboard summary of their behavior and ask reflection questions about what surprised them and whether they would change their usage.
- And measure: The percentage of participants who report surprise, increased awareness, or intention to change their AI behavior.
- Criteria: We are right if,
- At least 50% report meaningful increased awareness or behavioral reconsideration.
- If most participants report no new insight or intention to adjust their behavior, our intervention’s core value is weak.
Intervention Study Insights

We conducted a 5-day intervention study with 5 participants testing a Chrome extension that passively tracked AI usage (minutes, sessions, and prompts) and displayed a visual “resource meter.” Participants completed pre- and post-interviews, daily reflections, and we collected quantitative usage logs.
Our key research questions were:
- Does passive monitoring increase awareness of AI usage?
- Does visibility of usage metrics change behavior?
- What design elements sustain engagement over time?
The intervention did not meaningfully change behavior, but it revealed critical design insights.
First, passive monitoring quickly became invisible. As shown in the usage patterns graph, engagement dropped sharply after the first few days. Participants initially noticed the widget, but by the end of the week most described it as background noise. Several reported they “visually ignored” it unless it physically blocked something.
Second, usage patterns varied dramatically across participants. Some used AI for under 30 minutes per day, while others used it for 15+ hours during work sessions. The one-size-fits-all goal system failed because it did not account for individual workflows. For heavy users, the meter never meaningfully constrained behavior. For light users, it was irrelevant.
Third, awareness did not translate into behavior change. Even when participants acknowledged high usage, it rarely led to adjustment. The metrics (time, sessions, prompt count) did not map onto what they actually cared about. Participants consistently emphasized that quality of interaction mattered more than quantity.
Finally, technical issues significantly undermined trust. As shown in the critical issues graph, all participants reported inaccurate tracking and widget invisibility. Chrome-only tracking missed other tools (e.g., IDE integrations), and background tabs inflated usage time. Once trust in the data eroded, the intervention lost credibility.
Summary
The study revealed a fundamental misalignment: we were measuring volume, but users care about cognitive impact.
The next iteration should pivot from passive, quantitative monitoring to active, reflective engagement. Instead of counting minutes, the tool should help users evaluate whether AI supported their thinking or replaced it. Prompt-level reflection, context awareness (e.g., deadline vs. casual use), and cross-platform integration are far more valuable than daily totals.
Importantly, participants expressed strong desire for a tool that helps them improve their AI habits — just not in its current form. The failure of this intervention clarified that the opportunity lies in designing for intentionality and reflection, not restriction.