I wanted to reduce the amount of time I spent on social media (I included things like Youtube,Twitter, Reddit, etc), so I measured every time I would browse social media. Similar to Measuring Me part1, I logged my activities every 15 minutes for 3 days (Sunday through Tuesday).
Here is a small portion of the measurements I logged– I’ve highlighted my social media usage in yellow.

Full data can be found in this spreadsheet: https://docs.google.com/spreadsheets/d/10EA5SvHwSziMVyX7ItHPP3MCCAwTEtApKcI-xivGXGc/edit#gid=329806403
I noticed I would tend to use social media the most when during or after a meal, or when I had been working on an assignment for a long period. I would end up taking “breaks” that would end up being way longer than I intended.
In addition, because of the rainy weekend I feel like I spent more time indoors and in bed than usual, which might have something to do wth extended social media usage as well.
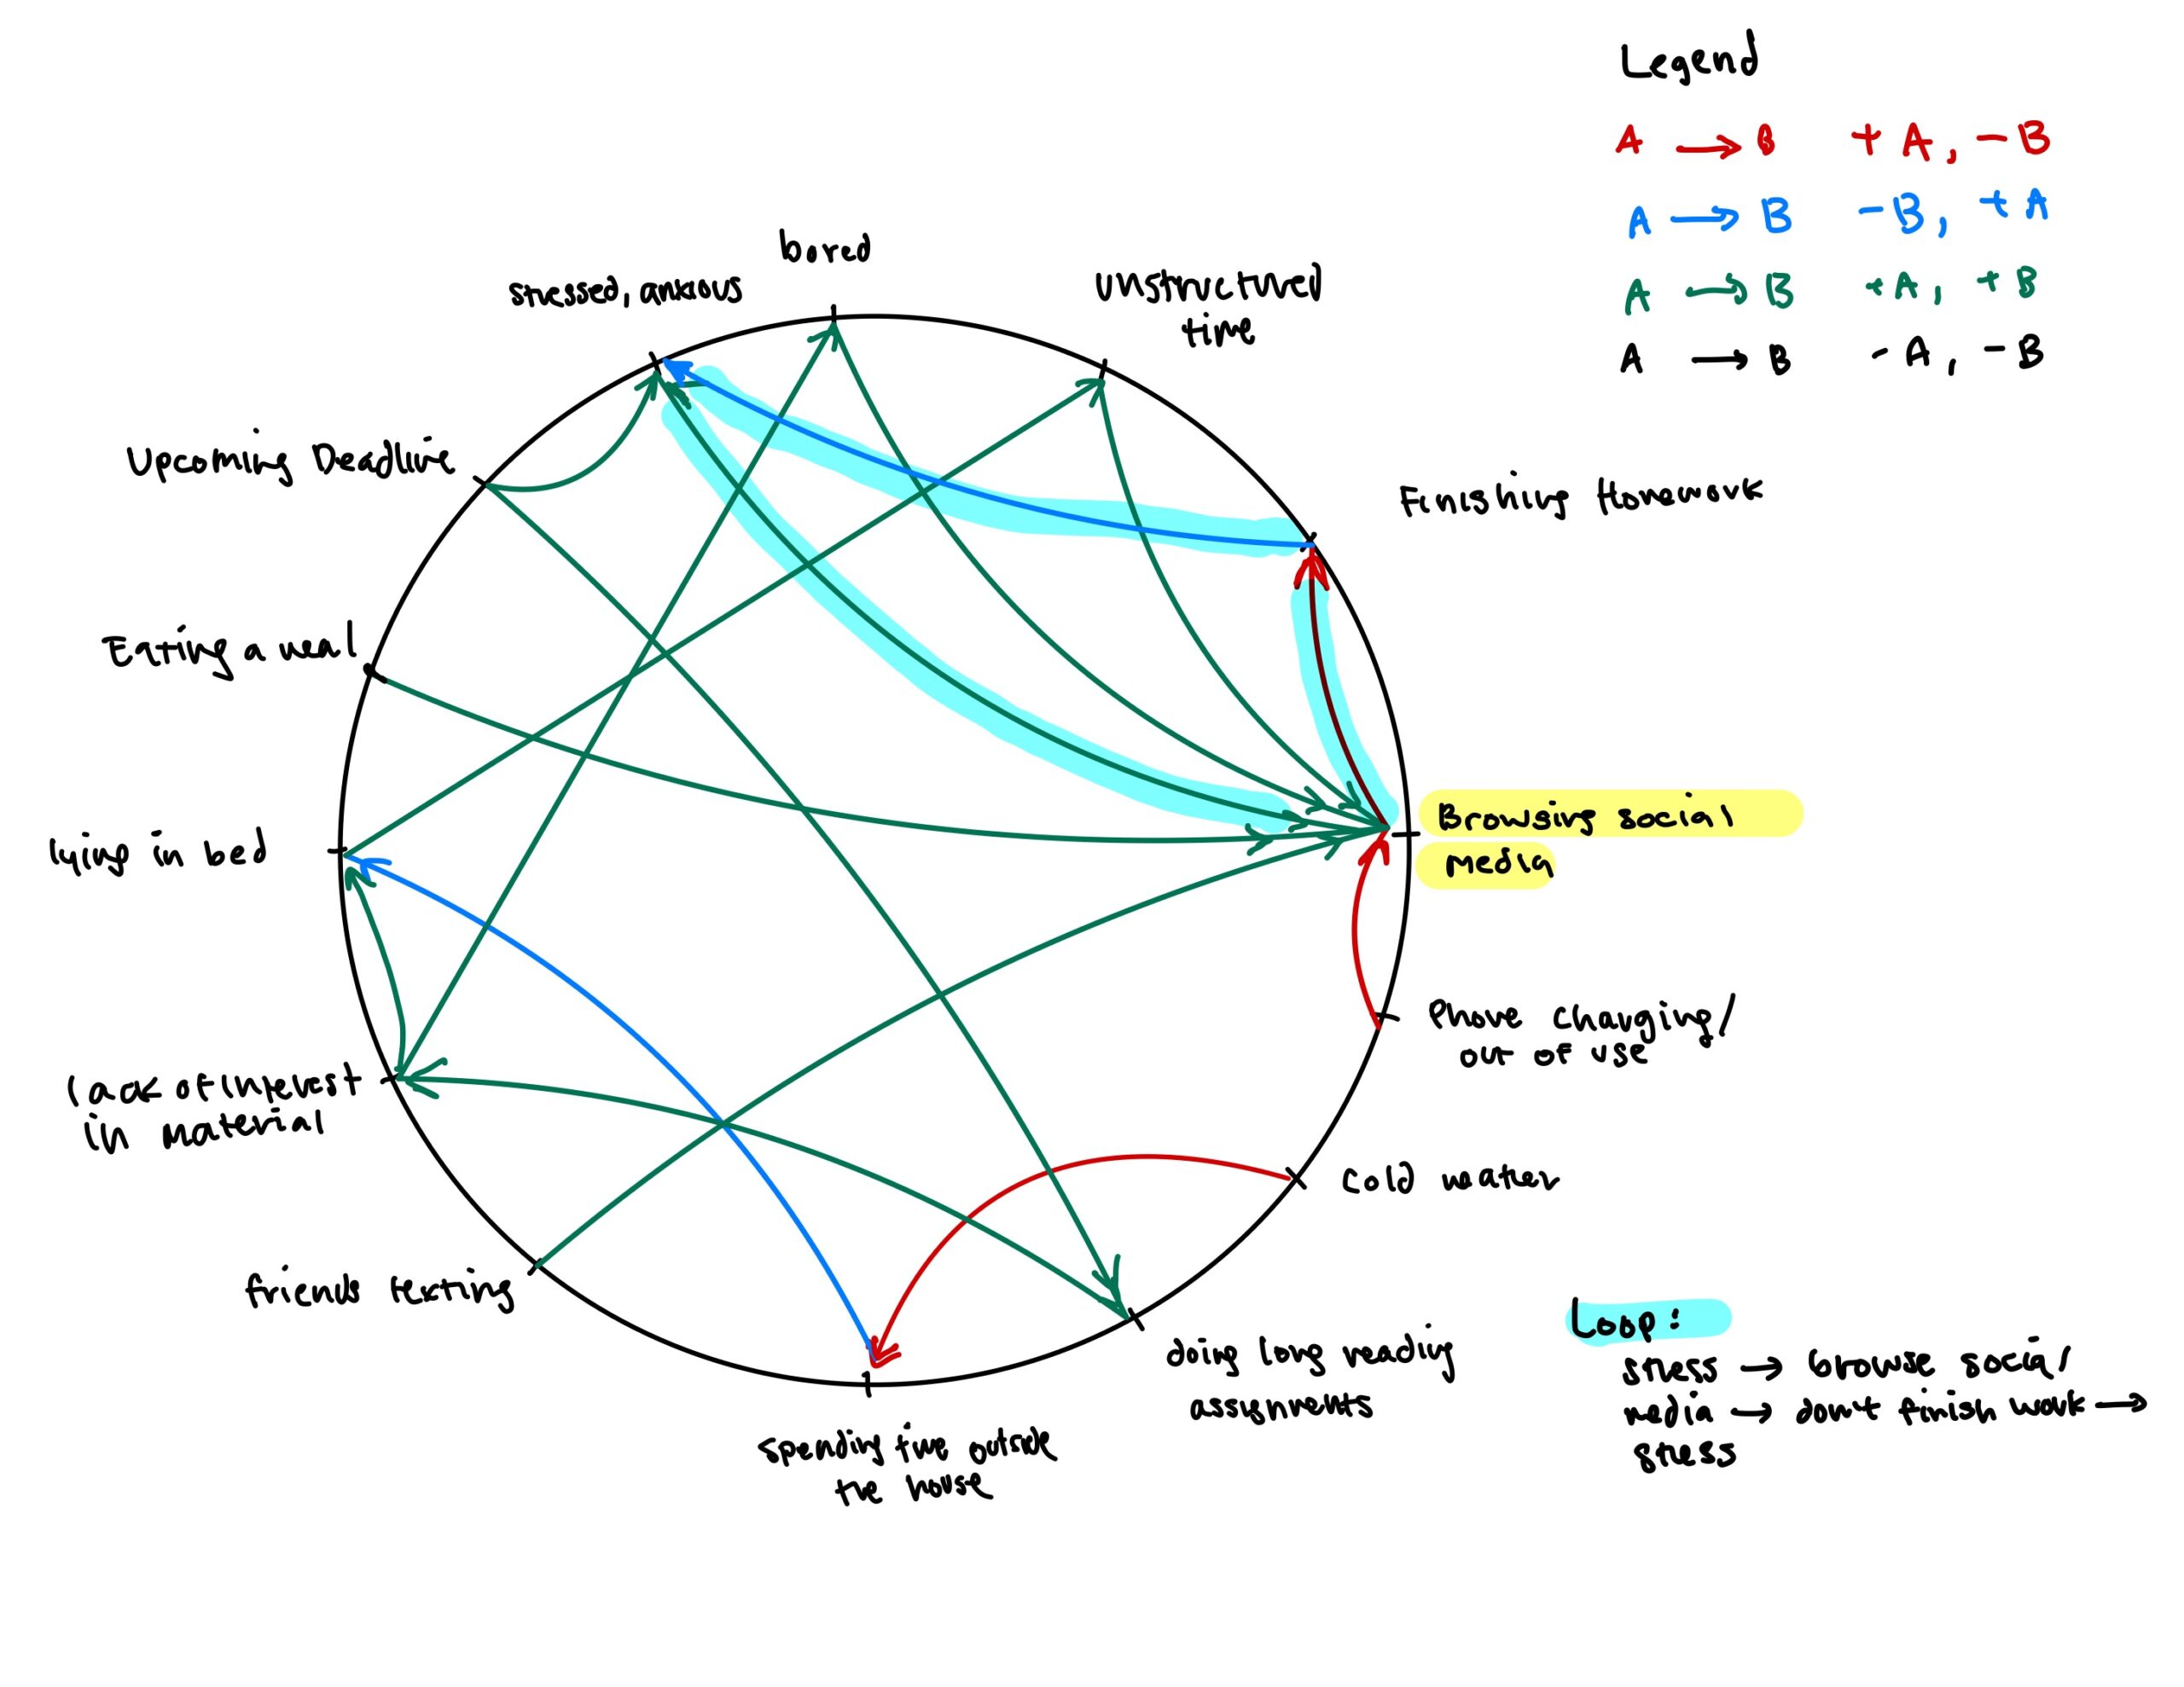
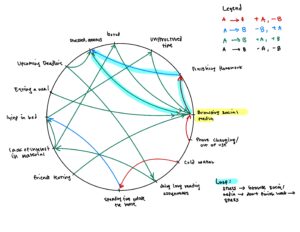
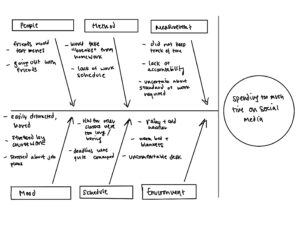
I modeled this relationship using a connection circle and a fishbone model.
Connection Circle
In this diagram, we can see a causality loop that emerged from the data. I tend to get stressed about upcoming deadlines, so I browse social media to take a break, but that results in me not getting work done. That makes me more stressed out, and the circle continues.
Fishbone Diagram
The fishbone model contains more detail about my schedule and environment and how those contributed to my behavior. . However, I think it was lacking in explaining how the different factors interact with each other.
Next time, I think I’d like to keep track of more of the context each time I do the behavior that I am trying to change. For example, I think it would be useful to make notes of my mood, the environment, setting at the time in addition to logging the activity. For this assignment, I managed to remember those things when looking back at the documentation since it wasn’t too long ago, but it would be useful for longer studies.