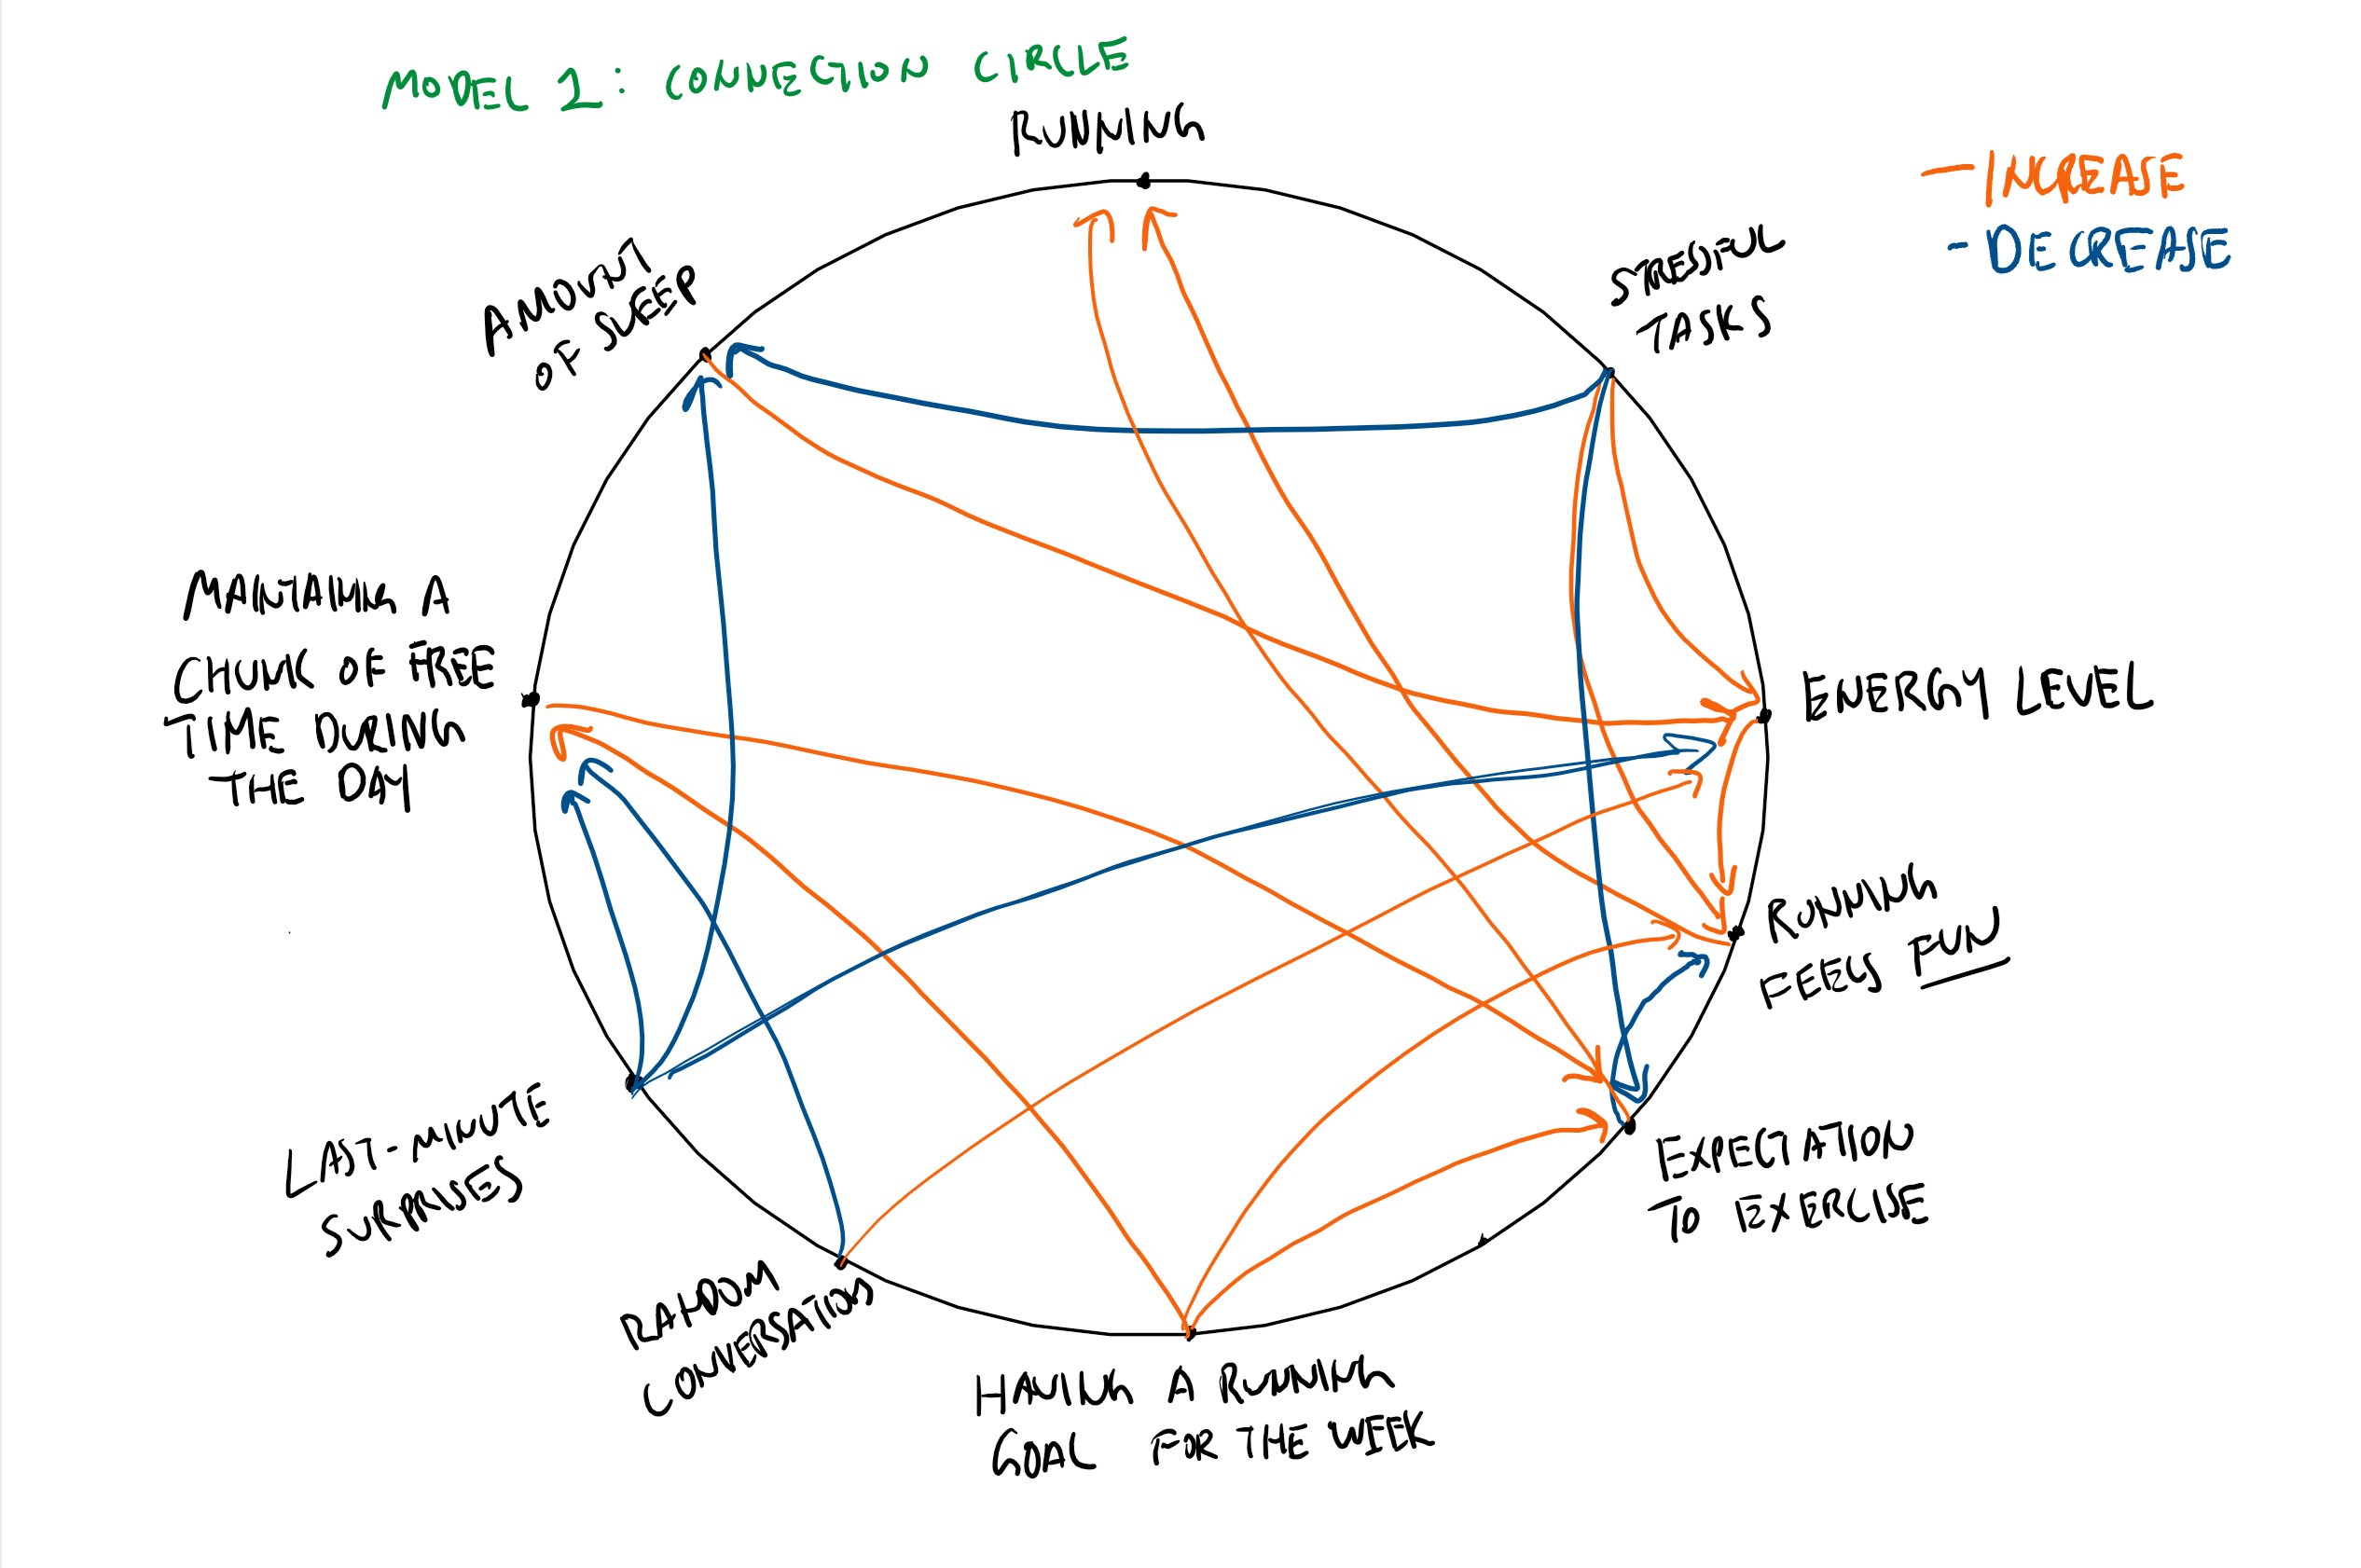
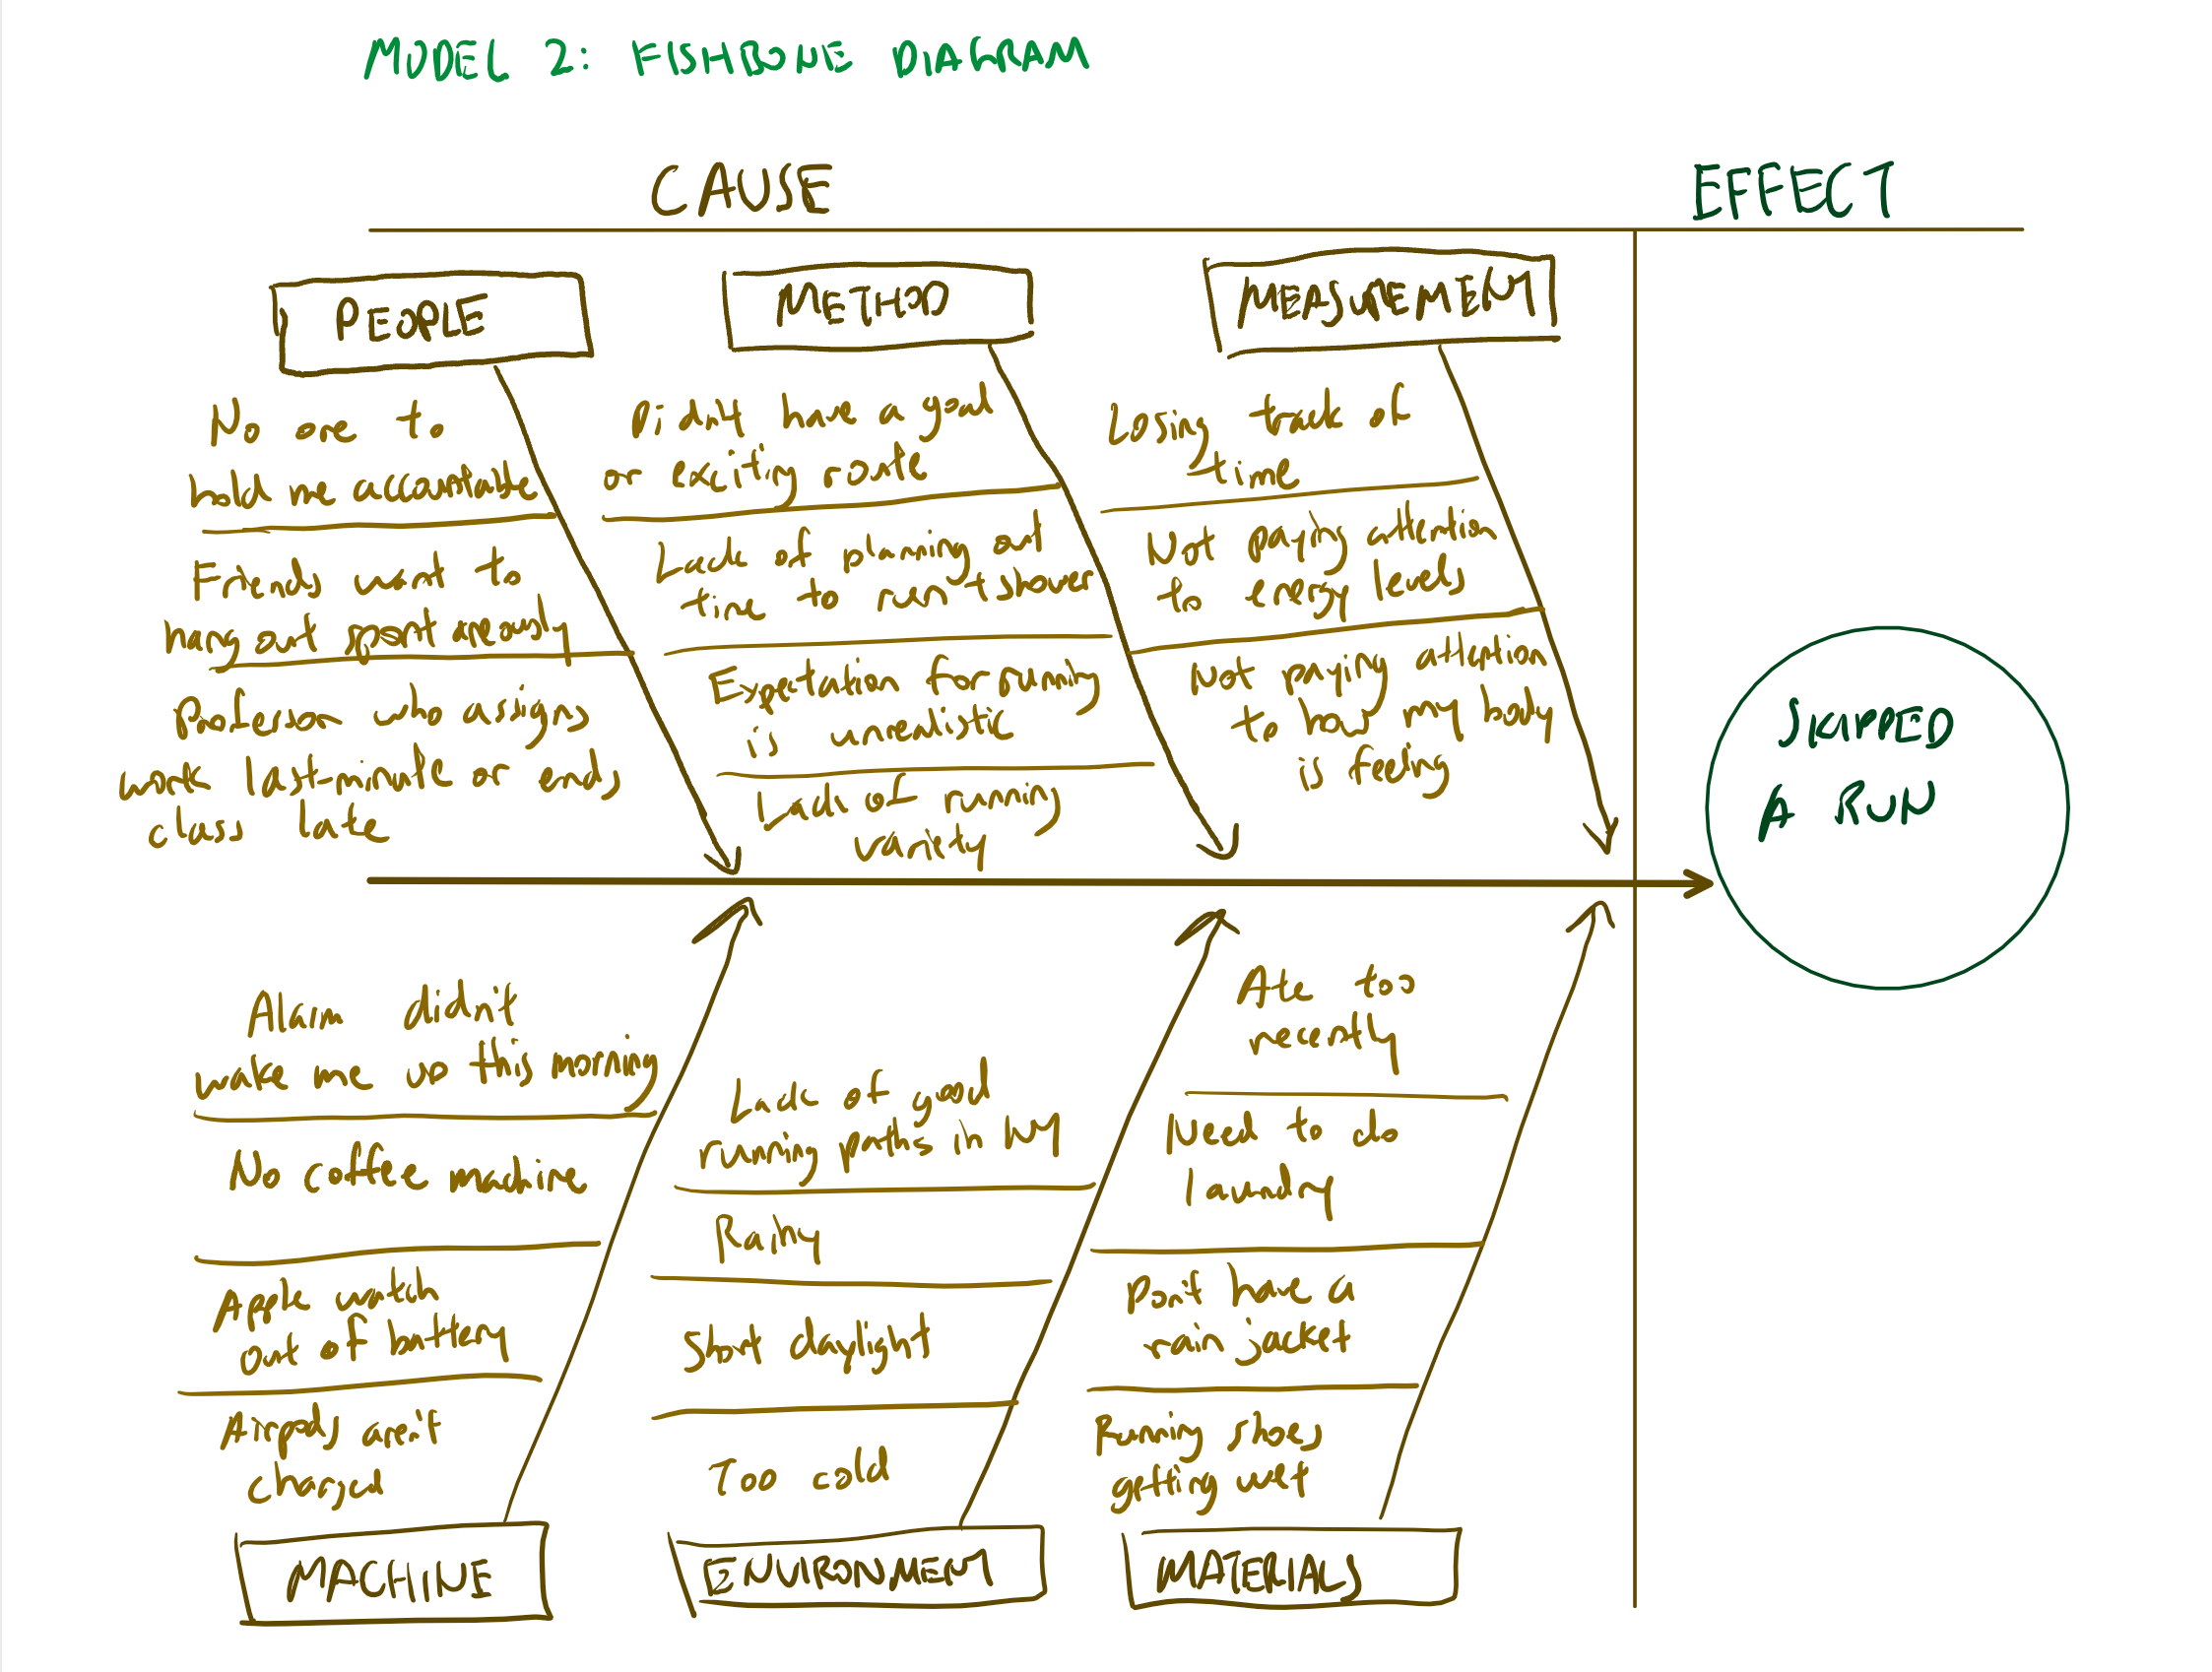
The behavior that I focused on for this round of measuring me was running. My roommate and I started running around the same time last quarter and we tentatively made plans to do a half marathon together by spring quarter. I’ve noticed that whenever I’m at home on break, I tend to slack off because my daily routine changes. Especially since my roommate has gone abroad this quarter, I’ve been less motivated to go on runs, as there’s no one to hold me accountable or to talk to about random running-related things that come up. Coupled with the rainy weather that’s hit campus lately, the window of times when it feels fun to run has gotten pretty slim. I thought the fishbone diagram was a nice way of illustrating specific factors that contribute to my skipping a run. In general, it seems to me that the fishbone diagram is a useful framework for exploring why a particular event happens while a connection circle is more suited for helping me understand the ecosystem of longer-term factors, cyclical factors that contribute to a behavior pattern or habit formation.
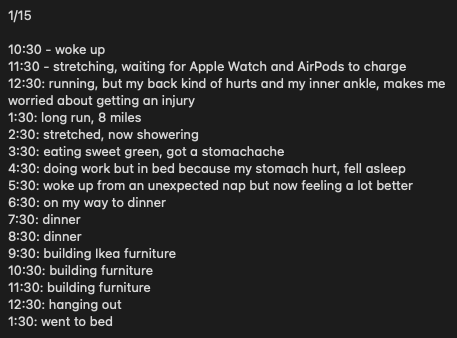
Through this exercise, I realized that to make up for the slowing cadence and lack of consistency in my running schedule, I’ve started going on longer runs on days when I have a lot of free time. For example, on the first day of measuring my behavior (a Sunday on a long weekend), I went on a run that was pretty challenging for me and ended up with a sore hip and ankle for the next few days. While immediately rewarding, this kind of overcompensation ends up hurting my overall goals of consistency and sustainability in behavior change. As you can see here, my notes (which I chose to do in one-hour intervals to capture my activities and energy levels before and after a run) show me struggling my way through the hours after the run. I also realized that I spend a lot of time preparing for my run and waiting for devices to charge because I enjoy using running apps and like to see the log of my pace and heart rate after a run. This ended up wasting a lot of time leading up to the run. If it weren’t for it being a Sunday when I didn’t have much to do, I probably would have just skipped the run because none of my devices were charged.
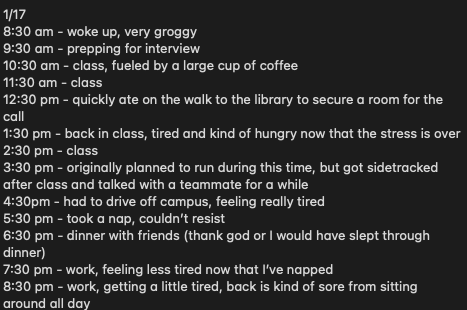
I had planned to go on a run on Tuesday, but ended up skipping it because I got caught up in a class and then had to head off campus. It made me realize how tight my schedule is and how I squeeze in runs so the entire thing ends up feeling either really rushed or doesn’t work out because things come up, more often than not. I also noticed that during the morning, I had a strong desire to go on a run because I was stressed out by an interview. As soon as that was over, I lost most of motivation, other than the burden of expectation, to go on a run.
Here is a connection circle showing the broader factors that I found to contribute to my frequency of running. Going forward, I hope to put less pressure on myself to run, instead perhaps shifting my mindset to viewing running as a form of stress relief and leveraging that as an activity to reduce anxiety.