Include your experience, models and what you’d do differently next time.
This weekend I measured how much water I drink. I started on a weekday, when my schedule is fairly regimented, and I mostly just have class and eat food. Then I continued into the weekend, as my schedule changes a lot in order to measure during more un-regimented times. I didn’t take the time-based approach because the intervals aren’t as useful, and the amount I drink is consistent — usually about 8-12 ounces — so it’s easy to measure in “times drank”.
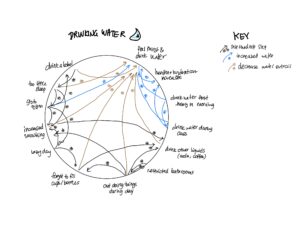
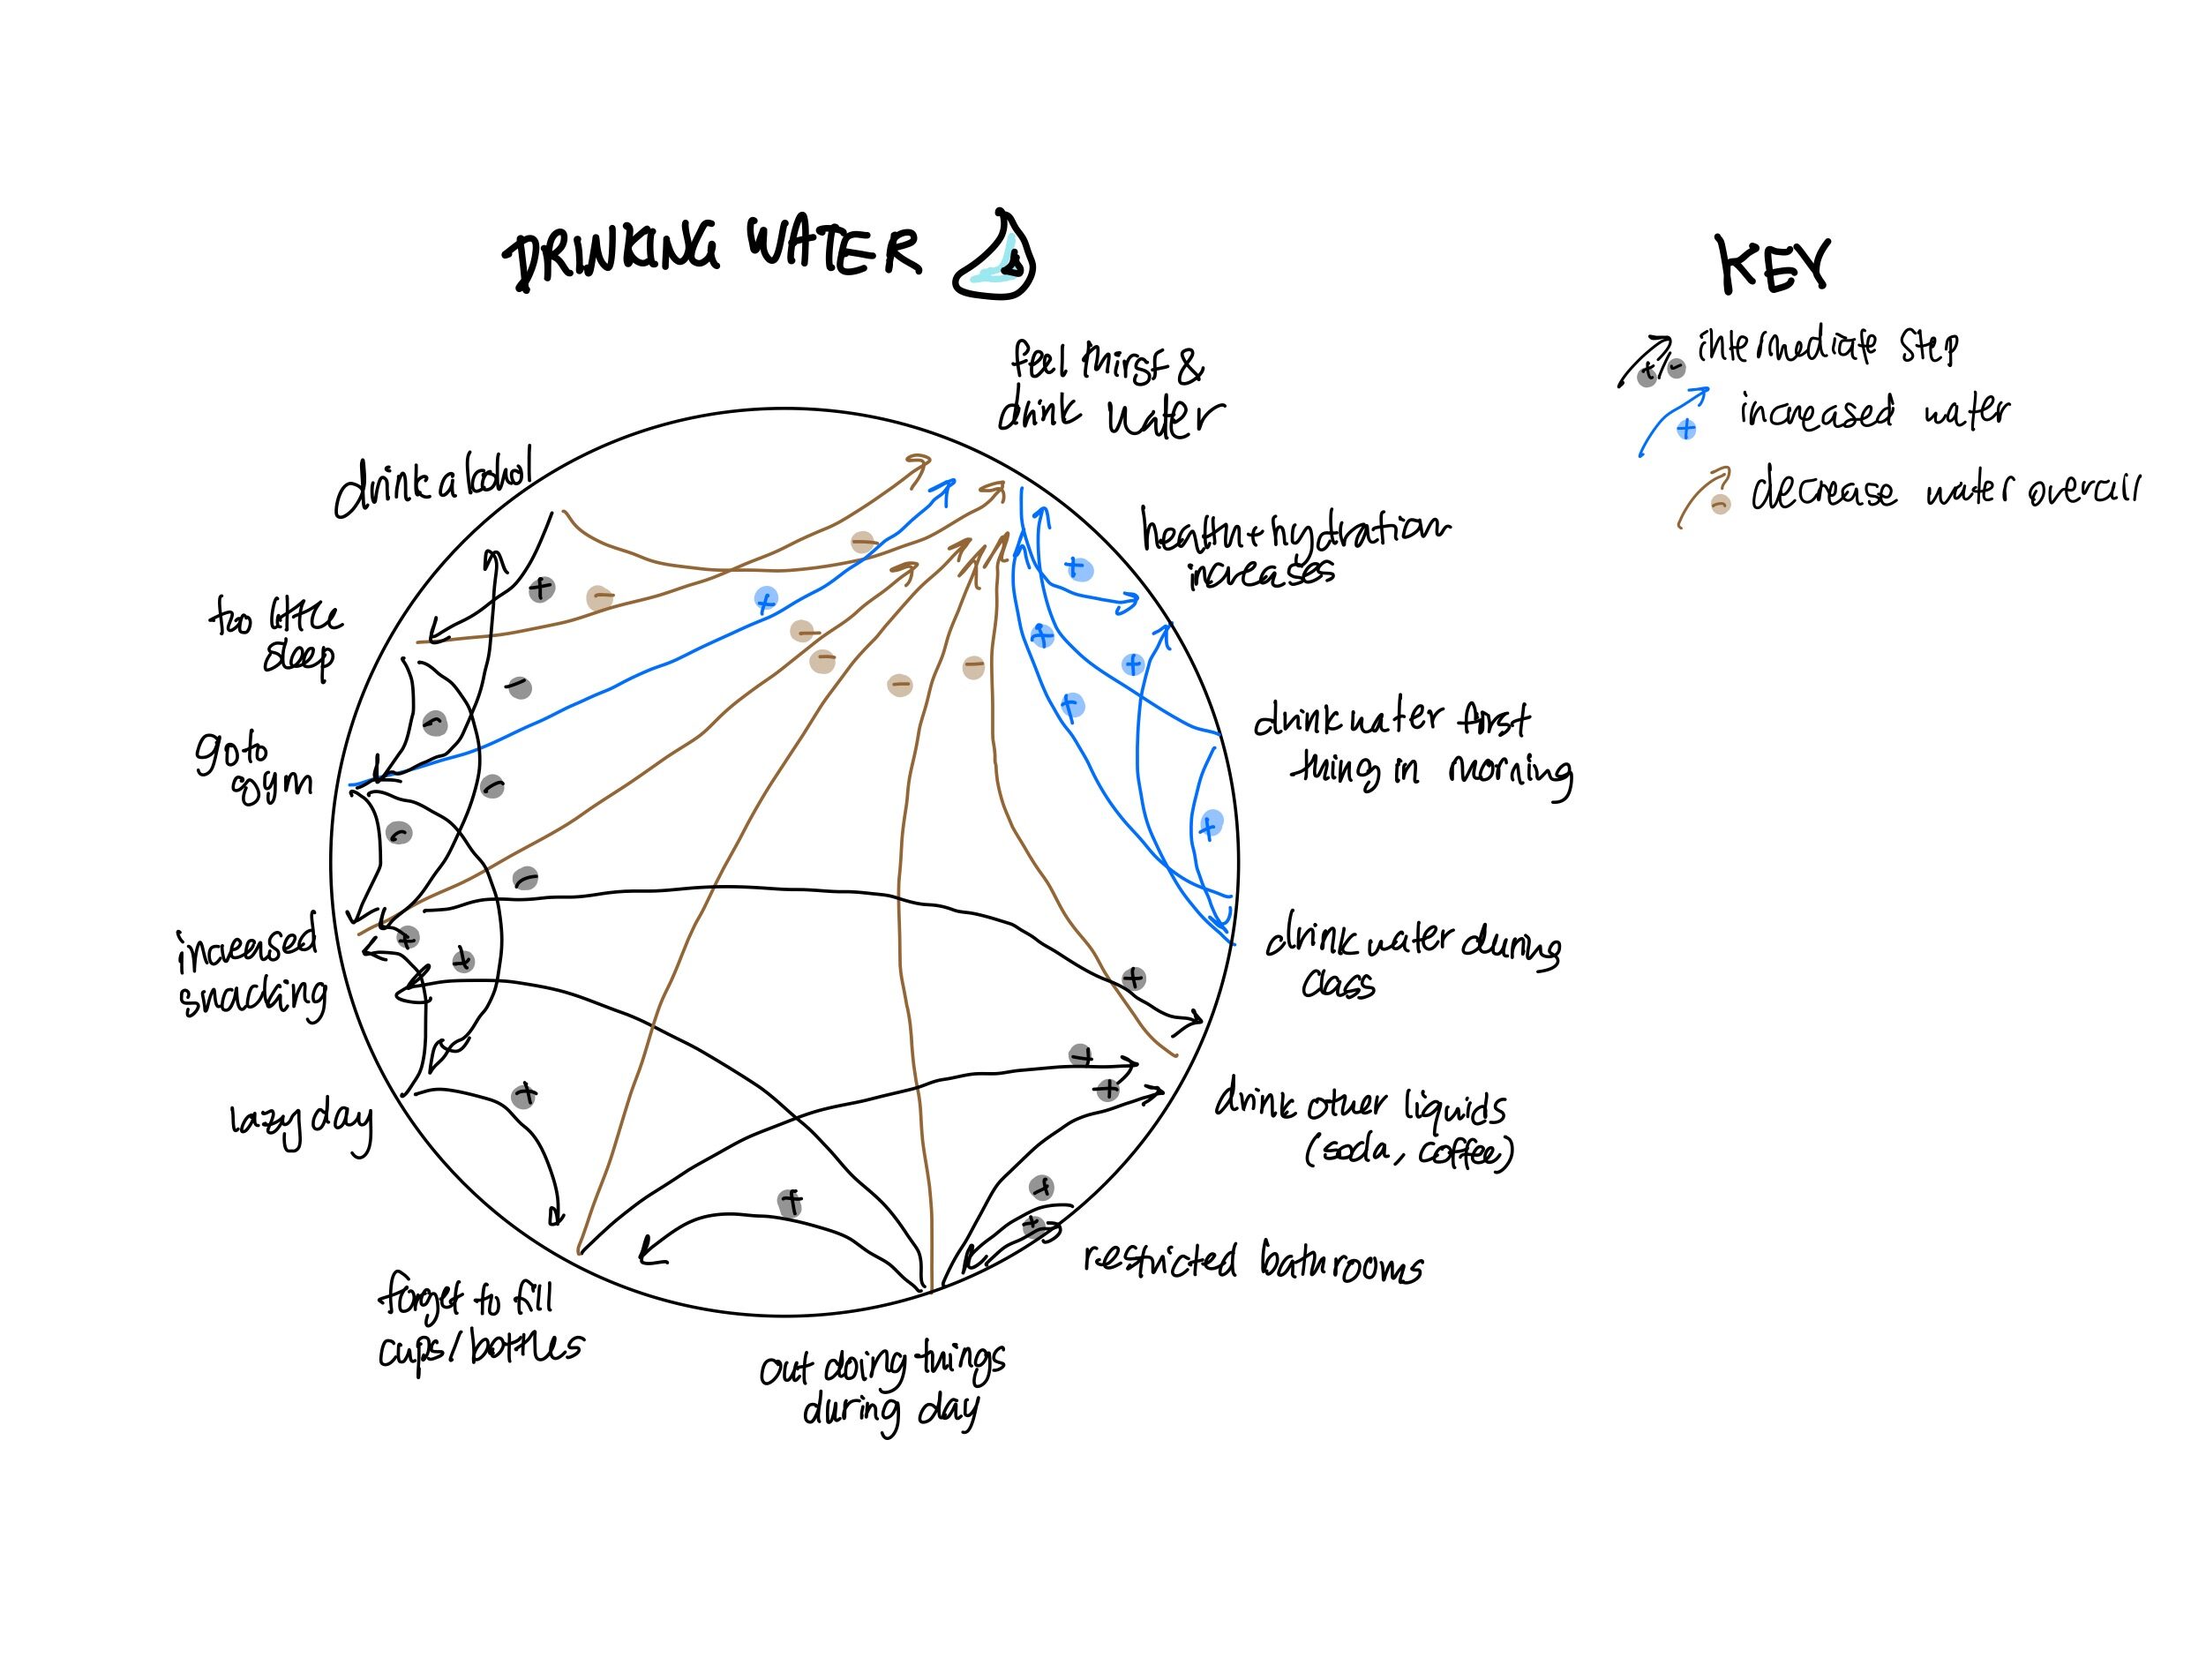
One interesting note was that there are more involved factors than I thought. I took note of all the things I did during the day, within reason, that could vary between weekdays and weekends. And I found that even though I feel like I don’t do much, there are many possible factors that contribute or take away from drinking water.
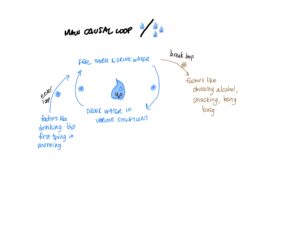
While constructing models, I color coded links, and this helped to reveal some clusters of habits. Interestingly, the majority of links were between factors (coded in black) that only related to other activities, and not to drinking water. Additionally, since there were so many factors, it wasn’t always clear what was directly contributing to what. Therefore, when I distilled the information into a simple causal loop (based on the clusters), it was easier to see that mostly drinking water makes me drink more water (ironically). During the simple causal loop helped me to see that I just need a few of the small habits to start the loop, but that a few small habits can also break the loop.
For this project, I only noted if something happened, to take inventory of all the contributing factors. However, next time, I might also measure the amount of times that I do a certain habit, to add “weights” to the arrows and see which habits are more worth investing in.