Story Maps
To create our story map, we first decided on a persona to focus on, which was the “I’m Just A Girl” persona. We selected this persona because we felt like there were many diverse scenarios we could explore, since this persona is someone who tends to make a variety of impulsive purchases based on trends/outside influences. We crafted a story of a person who was scrolling through social media, was inspired to purchase a trendy tote, but ultimately decided not to go through with the purchase after reading through mindful shopping prompts that guided them in the right direction. We came up with several potential mindful shopping prompts the person would have seen in this story as well. After crafting our story, we categorized the different sequences of the story into “Inspiration Trigger,” “Deliberate Purchase,” “Reflection,” “Realization,” and “Prevent Purchase,” and designed our MVP features/user stories to address each one. Finally, we created a “rainy day” scenario, where the mindful shopping prompts don’t end up changing the person’s mind, which leads them to later regret their purchase. Our story map images are attached below.
Our Initial Story Map in Class:
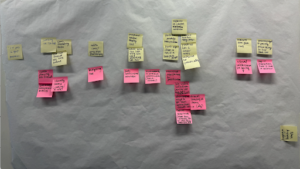
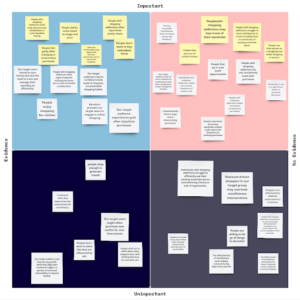
Our Final Story Map (Rainy Day Version Included):
The Miro Board for our final story map is here as well.
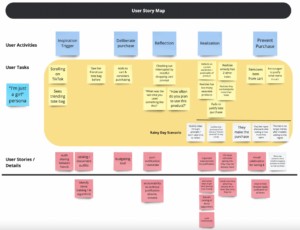
From our story map, we saw that the critical time for changing someone’s decision was when they saw their cart and evaluated the items in the cart. We also noticed that the prompts themselves were super important; if they didn’t engage the user or cause them to change their thinking in a meaningfully different way than their usual thinking process, the user would be led into the rainy day scenario.
This led us to develop our MVP features, which are listed below. We wanted to use both mindful shopping prompts and substantiated evidence (in the form of the life value calculator, which shows them how likely they are to actually use the item) to guide the user to make wiser purchasing decisions.
MVP Features
- Outfit catalog built up by user through photos
- Outfit sharing between friends (social aspect)
- Budgeting tool (breakdown of purchase history, setting goals, etc)
- Push notification/reminders (to do mindful shopping prompts)
- Organized steps/process for justifying purchases
- Life value calculator (gives user additional context about their purchase, such as how often they used a similar item in the past)
- Visual celebration for saving money – reward system
- Additional mindful shopping prompts after impulse “bad” purchases
System Paths
We created three system path maps – one for a general happy path and two for each of our personas. The general system path was a base for the two persona system paths.
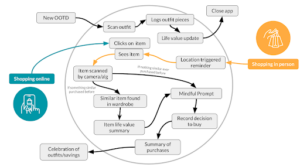
We expect our users to take pictures of themselves in their outfits as a means to log their wardrobe items. Our baseline and intervention studies showed that our interviewees used both in-person and online shopping so we wanted to provide that flexibility as well. Here, the yellow shows the path through which a user would physically scan an item in-store to calculate its life value and corresponding mindful prompt. The blue path shows the path of an online shopper. An algorithm running in the background will automatically scan the item the user clicks on and will show a pop-up of the item’s life value and mindful prompt.

Our “I’m just a girl” persona is a user who likes to stay on top of trends, but struggles to do so when trends are changing so rapidly. These rapid changes cause overconsumption and impulsive purchases that aren’t used beyond the short-term trend. Our mindful prompts focus on durable goods – as clothing are items that should be used long term. The solution aims to give alternatives to styling similar items that the user already owns – as a means to save money, reduce overconsumption, and also providing a fun space for the persona to explore different styles and outfits with immediately accessible items.
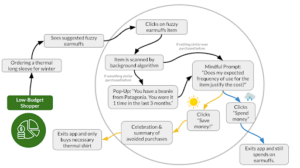
Our “Low-Budget Shopper” persona is someone who wants to limit their online spendings but tends to fall to temptations when given enticing suggested items related to their intended purchases. For example, when purchasing a thermal shirt, they may also receive suggestions for earmuffs or gloves. Since their needs are more based on financial limitations, we hope to target a celebration of avoided purchases (savings) in addition to suggested styling tips for similar items they already own.
Although these system paths were created separately to prevent cluttering, we were able to learn the needs of our top two personas. Different mindful prompts and different celebration pages may be needed. For example, our “I’m just a girl” persona may care more about styling tips whereas our “low-budget shopper” may care more about a celebration of savings. In our next steps, we hope to evaluate which needs we would like to prioritize in our solution and whether we can combine these two system paths.
Bubble Map
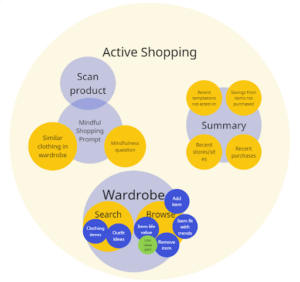
(Periwinkle bubbles are sized by time spent on them.)
The main components of our solution are scanning clothing items to compare against those in the user’s personal wardrobe, viewing their wardrobe, and practicing and celebrating mindful spending to save money. Since the user engages with all of these components when they are in the shopping or dressing-up mood, the components fall under “active shopping” and are broken up into different sections sized by how long we expect the user to spend on them. For example, scanning a product may be quick or take a bit of time depending on how nice a picture the user wants to take, while searching and looking through the user’s wardrobe will usually take them a lot more time to browse and deliberate. From these periwinkle bubbles, the main sections of the app we are designing would be scanning articles of clothing, viewing a mindful shopping prompt, browsing and managing the user’s wardrobe, and a summary of recent shopping activity.
A bubble we had not expected to be so large (or thought would exist at all in the beginning) is the “summary” bubble, where the user is able to remind themselves of and reflect on recent purchases and near-purchases and how these may have affected their personal finances. We thought to include this as a sort of “home” for the app, although we expect users to spend more time in the wardrobe section and use the app mainly for the wardrobe managing feature.
While adding subcomponents, we realized that the wardrobe would be the only one to house so many features, which makes sense since it is where the user would be spending the most time. With most of the functionality of the app living in this component, it may make more sense for us to use the wardrobe instead of the summary as the “home” page for our app.
Assumption Map
Miro Link: https://miro.com/app/board/uXjVNsAA2mM=/?share_link_id=722329789808
Key Insights
- Shopping Habits and Mindfulness:
- There is a significant focus on the impact of mindfulness on shopping habits. Providing mindfulness tools could potentially reduce impulsive purchases among individuals with shopping addictions. However, there’s a recognition that certain shopper segments, like those driven by discounts, may not be as influenced by mindfulness practices.
- Awareness of Possessions:
- People with shopping addictions may lose track of their wardrobe, which can lead to redundant purchases. Tools that help these individuals keep better track of what they own might mitigate this issue.
- Social Influences:
- The role of friends, family, and social media appears to be significant in driving purchase decisions. This suggests that social proof and endorsement may have a strong influence on consumer behavior within our target audience.
- Consumer Behavior:
- The map points out that boredom can lead to online shopping and that guilt often follows impulsive purchases. Understanding these emotional triggers could be key in developing interventions that help manage such behaviors.
- Usage and Value Perception:
- Our target users may not track their product usage or the value they derive from it, which could lead to purchasing items that are not used frequently or do not offer good cost-per-use value.
- Resistance to Advertising:
- People do not wish to appear as if they are influenced by ads, which could indicate a potential underestimation of advertising impact on buying habits.
- Event-driven Purchases:
- People may often purchase new clothes for one-time events often, suggesting that event-driven shopping could be a common behavior among our target audience.
- Shopping Tools:
- The map assumes that the target audience uses their phones as shopping tools when shopping in-person. This points to a comfort with digital aids in the shopping process, which could be leveraged in our solution.
- Brand Consistency:
- The assumption that customers often buy from the same brand for consistency highlights brand loyalty as a potential factor in shopping behavior.
- Resistance to Change:
- The map notes that people are generally willing to let go of things, but this might not be as applicable to individuals with shopping addictions who could have difficulty parting with possessions.
From these insights, it’s clear that the assumption map is guiding toward solutions that enhance awareness of personal inventory, leverage digital tools to aid shopping decisions, and incorporate mindfulness to alter shopping patterns. Any MVP developed from these insights would likely feature wardrobe tracking, mindfulness prompts, and perhaps social sharing capabilities that allow for community or family input into purchase decisions. Additionally, understanding the nuanced responses to advertising and discounts can help tailor the solution to be more effective for the target user base.
Assumption Testing
1. Assumption: People use their phone as a shopping tool while shopping in-person.
-
- Test Name: In-Store Mobile Usage Survey
- Method: Conduct a survey with shoppers at a variety of retail locations, focusing on clothing stores. Approach shoppers at the store exit or while they’re browsing, ensuring they’re not too busy to respond.
- Questions:
- Did you use your phone today for any shopping-related activities while in-store? (Yes/No)
- If yes, what were the primary reasons for using your phone? (Multiple choice: Price comparison, Product reviews, Similar products, Consultation, Store’s app, Other)
- How often do you find yourself using your phone for shopping assistance while at a physical store? (Multiple choice: Rarely, Sometimes, Often, Always)
- Do you believe using your phone helps you make better shopping decisions? (Open-ended)
-
- Objective: To ascertain the frequency and context in which shoppers use their mobile devices as part of their in-store shopping experience.
- Success Metric: A significant majority of respondents regularly using their phones for shopping-related tasks would validate the assumption.
2. Assumption: People with shopping addictions may lose track of their wardrobe.
-
- Test Name: Wardrobe Check Challenge
- Method: Create an interactive challenge for participants by asking them to list items from their wardrobe from specific categories (e.g., jeans, black clothing, etc.).
- Questions:
- Can you list all the types of [item category] you own without checking?
- How accurate do you think your list is?
- Was there anything you had forgotten you owned?
- How do you visualize and categorize the items in your wardrobe?
-
- Objective: To assess the awareness individuals have of their wardrobe contents.
- Success Metric: Difficulty in accurately recalling items or a high number of forgotten items would suggest that many do not keep close track of their wardrobe contents.
3. Assumption: People are open to using tools that involve documenting their outfits (taking pictures of outfits).
-
- Test Name: Outfit of the Day (OOTD) Frequency Check
- Method: Conduct a quick poll or survey in social groups, online communities, or among acquaintances asking about their habits related to taking outfit photos.
- Questions:
- In the last month, how often have you taken a picture of your outfit or yourself in an outfit? (Multiple choice: <5 times, 5-10 times, 10-20 times, 20-30 times)
- What prompts you to take a picture of your outfit? (Multiple choice: Share on social media, Personal record, Style inspiration, Other)
- Objective: To validate the hypothesis that people frequently document their outfits through photographs.
- Success Metric: An average frequency of 5-10 outfit pictures per month among respondents would confirm the assumption.
Intervention Study
Our intervention study focused on having participants use mindful shopping cards when they were shopping. We faced a few challenges with getting responses from our participants, who were mostly students. Because it was midterm week, many of them were busy, and did not shop a lot. We only had 4 participants fill out entries in the intervention study shopping diaries we gave them, so the findings we got from our study were somewhat limited. Despite the setbacks, we were still able to gain valuable insights.
First, we learned that several of our participants were initially confused by the instructions we sent out, which was a multi-step process involving using random sequences of numbers to determine which mindful shopping card to look at. They also felt it was inconvenient to go into their email to access the shopping cards and diary to log their shopping behavior. Then, we learned that the mindful shopping cards were more effective in certain situations than others. Notably, when participants were making necessary purchases such as textbooks or purchases they knew they wanted, they found less value in using the shopping cards. Situations where the shopping cards helped a lot were ones where they needed to narrow down their shopping carts or were very conflicted about a purchase. We were also able to gain insight into which questions were successful, such as “Does the quality match the price you’d have to pay for it?”, which caused one of our participants to not buy a low quality $30 Express top and instead buy a quality $150 trench coat that she thought she could wear over and over again.
We had several key insights from our intervention study that changed our solution design. Our first insight was that our mindful shopping cards should be simple to use and understand in order to be the most effective. In our solution design, we plan to have streamlined processes that guide the user through the questions, rather than the user having to generate their own numbers, going through a slideshow of cards, and screenshot their cart. This ease of use is especially important if we want users to make it a habit, which is something that one of our participants pointed out. Another insight we had was that questions that focused on the long-term value of an item were effective. Questions about quality and frequency of use were cited as ones that changed the participant’s minds. Because of this insight, we plan to add a life value calculator to show the user how much value they’ve gotten out of similar items in the past, which will reinforce this line of thinking and hopefully reduce impulsive purchases. Overall, our intervention study was very helpful in fine-tuning our solution.