Test Cards
Test Card 1: Driving strategic product decision-making
- Hypothesis: Stakeholders will commit to a direction after seeing Cookin’s analysis, even when it favors someone else’s idea.
- Observation: 3 Stanford teams (8 people). Of the 5 people whose idea lost, 2 rated the verdict fair after the summary (2.8/5) and 4 after seeing the evidence (4.2/5). Two teams decided and one agreed on a follow-up test.
- Learning: It works only with evidence. A bare verdict reads as “the AI’s opinion,” and trust breaks when the evidence doesn’t fit the team’s context.
- Decision: Show the evidence with every verdict, flag thin or poorly fitting evidence, and suggest a follow-up test when Cookin’ can’t settle a disagreement.
Test Card 2: Cookin’ dents confidence, not decisions
- Hypothesis: At least 60% of testers drop their confidence by 2+ points (on a 10-point scale) after reading Cookin’s case for the other option.
- Observation: 10 Palo Alto coffee-shop patrons. 7/10 lowered their confidence but only 3/10 by 2+ points (7.25 → 6.1). No one switched. The most confident dropped the most.
- Learning: Cookin’ creates doubt but doesn’t change minds (30% vs. the 60% bar). Testers wanted harder evidence to act on.
- Decision: Make the counter-case more concrete with quantified risks, then re-run with 15+ testers and a control group, tracking switches as well as confidence.
Test Card 3: PMs can’t price what they can’t picture
- Hypothesis: At least 4 of 6 PMs understand the landing page and at least 3 of 6 would pay $20 per successful simulation.
- Observation: 0 of 6 understood the page and 1 of 6 would pay. One read it as a recipe site, and the top request was a demo.
- Learning: People can’t value a product they can’t picture. The page leads with mood over meaning, and showing the price first reads as a risk.
- Decision: Lead with a plain value prop and a real Kitchen result, and move pricing below “How it works.” Retest with 6 new PMs using a 5-second test (pass: 4 of 6).
Prototype Changes
- Simulation fixes: New metrics start at a real zero instead of a placeholder of 100. Options are measured as progress toward the target, and baseline and target must use the same units. This targets the useless 0% and 96–100% success odds from Evals 2 and 4.
- Onboarding: People can browse before setting up a company. “Decisions” is now Pantry, the example prompts were removed, and the Kitchen simply asks “What needs deciding?”
- Visual redesign: A blue glass theme, a new wordmark, and one icon set in place of emoji. This responds to the Test Card 3 feedback that it was “too artistic” and looked like a recipe site.
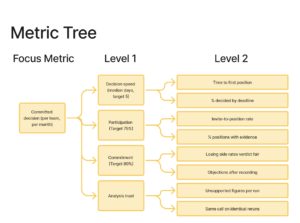
Metrics Tree
Evals & Results
Eval 1: Historical Decisions (Pass)
- Objective: Can Cookin’ evaluate past business decisions using only information that was public at the time?
- Setup: 10 major decisions from the past 10 years, each scored on whether Cookin’ reached the same or a defensible conclusion, found the real decision factors, matched what happened afterward, and avoided hindsight.
- Score: 92.6/100 (Claude) and 92.3/100 (ChatGPT).
- Conclusions: The graders agreed in 9 of 10 cases. Cookin’ matched the real call for Microsoft–LinkedIn, Amazon–Whole Foods, Disney, Apple Silicon, Nvidia–Mellanox, Salesforce–Slack and the Netflix ad tier. Its Meta call (a staged metaverse bet) and Adobe call (passing on Figma over regulatory risk) were rated defensible alternatives. Intel was the only split.
- Factors and hindsight: It found all 5 key factors in every case, with no use of information from after the decision.
- Accuracy against what happened: 3.9/5 (Claude) and 4.3/5 (ChatGPT). It predicted the risks that came true but set targets well below the actual results.
- Caveat: The model may know these outcomes from training.
Eval 2: Cookin’ vs. General-Purpose AI (Fail)
- Objective: Does Cookin’ beat ChatGPT and Claude on the same documents and proposal?
- Setup: 5 identical proposals, scored on time, accuracy, depth, useful insights, consistency with the documents, and recommendation quality.
- Ranking: Cookin’ was never picked as best. Claude chose plain Claude 5 of 5 times, and ChatGPT, grading blind, chose Claude 4 times and itself once.
- Scores (Cookin’ / ChatGPT / Claude): Accuracy 3.2 / 4.2 / 4.0, consistency 2.2 / 4.6 / 3.8, depth 4.0 / 3.4 / 5.0, insights 12.2 / 9.8 / 17.0, and recommendation 4.4 / 4.4 / 5.0.
- Problems: All three tools reached the same conclusion, but Cookin’ invented revenue targets, used churn as its growth trend, and showed success odds that couldn’t separate options (“do nothing” at 96–100%).
- Speed: About 16.6s per proposal for Cookin’ and 18.3s for Claude. ChatGPT answered all five at once in 40s.
- Takeaway: Cookin’s format currently costs depth. Its advantages are structural: the options view, stakeholder positions and a decision record.
Eval 3: Interpreting Company Data (Partial Pass)
- Objective: Can Cookin’ correctly interpret a company’s own metrics?
- Setup: Synthetic revenue, CAC, retention, churn and engagement data, plus the question “Retention or acquisition?” Checked against manually verified calculations.
- Score: 39/100 (Claude) and about 34/100 (ChatGPT).
- Got right: Retention first, 5.5% monthly churn, and the strongest signal: one-feature customers churn at 9.8% a month vs. 2.1% for customers using three or more features.
- Missed: It never calculated LTV ($1,637), LTV:CAC (1.23, where healthy is 3+) or payback (14.8 months against an 18.2-month customer lifetime).
- Errors: It misstated average CAC, said churn was rising when only the number of customers lost grew, and assumed 3% growth instead of the actual 5–7%.
- Fix: Calculate standard metrics in code from the uploaded data.
Eval 4: Conflicting Evidence (Pass, best result)
- Objective: Does Cookin’ acknowledge conflicting evidence instead of cherry-picking?
- Setup: Internal data showing engagement falling, alongside market research showing demand for an AI feature.
- Score: 84/100 (Claude) and 88/100 (ChatGPT).
- Strengths: It named the conflict directly (5/5): 64% survey interest vs. engagement falling from 41% to 29% and only 4% of feature requests mentioning AI. It also named the missing information (5/5) and didn’t treat survey interest as proven demand.
- Recommendation: Fix the core product first and ship a small AI version, with medium confidence.
- Weaknesses: It didn’t explain why stated demand and actual behavior differ (3/5), invented a −2.5% trend, and showed 0% success odds for every option.
Eval 5: Stability (Partial Pass)
- Objective: Does Cookin’ hold steady on trivial changes but adapt to material ones?
- Setup: The same proposal rerun with one variable changed each time: cost, demand or engineering capacity.
- Big changes: It responded correctly to all 3. At 5x cost it switched to a phased MVP. With one engineer it chose a one-way sync. When demand collapsed it sided with the documents over the typed-in assumptions.
- Trivial changes: It drifted. An exact repeat picked a different metric and target, the same option scored 98% in one run and 15% in another, and a 3% cost increase changed the recommendation with no explanation.
- What held: The overall strategy stayed the same across all runs, and option scores moved 0.5 points at most.
OKRs
Objective: Prove that Cookin’ gets product teams from disagreement to a decision they’ll stand behind, faster.
KR1: 5+ product teams close a contested decision in Cookin’.
KR2: 3+ teams start a second decision without prompting.
KR3: At least 80% of participants say they support or will commit to the final decision.
Reading
Christina Wodtke, Introduction to OKRs: Keep metrics out of the objective. Our objective is qualitative and inspirational, and every number lives in the KRs.
Failed Assumption
We assumed Cookin’s success odds would help teams compare options, but they couldn’t tell options apart: “do nothing” scored 96–100% in Eval 2, and every option scored 0% in Eval 4. The causes were invented targets, a hidden placeholder baseline and mismatched units. The revised prototype now starts new metrics at zero, measures progress toward the target and requires matching units. Next, we’ll re-run the evals to confirm the fix.