
Team 12: Experiment Synthesis
As part of our testing, we ran three experiments. The first experiment was around scheduling, and tested the assumption that we could use a scheduling tool to plan out when people would be using social media. The second and third experiments were focused on user behavior – if users viewed posts more than stories, and if users would read and follow prompts on stories and feeds.
Our previous blog post describes our thought process further.
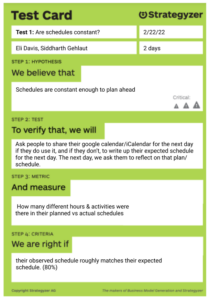
EXPERIMENT 1: Scheduling
For our first experiment, we recruited people who had expressed interest to us in the past, or who were already part of our experiment. We had Catinca and Kevin, who participated in our previous experiment, and Sarah, who had expressed interest in the initial trial of the project, but hadn’t been able to participate. All three are users who align to our Social Sally persona, and want to reduce their screen time.
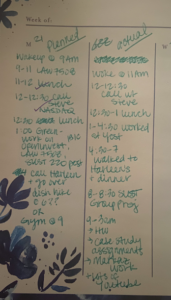
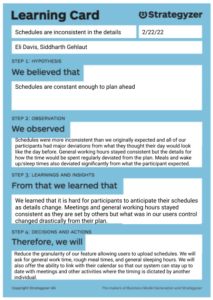
Our experiment followed our test card closely. We asked our participants to share their calendar if they used one, or if they didn’t, to write out their schedule and then compare it to what they actually did throughout the day. With our real intervention, we expect people to put in general schedules, or connect with their existing calendars, so we let people be as specific or general as they wanted when scheduling their day.
(See our detailed results here!)
In our results, we found lots of deviation from everyone’s plans. Kevin, for example, planned to golf. However, there was a tournament at the course, so he had to change his plans once he woke up. Sarah thought she had a class on Monday, but realized that she had no class due to the long weekend. The major chunks of time – like class, pre-set meetings, meal times – roughly stayed the same. However, a lot of shorter chunks of time like workouts, wake-up/sleeping times, and unstructured leisure time changed a lot from what each participant expected. Moving forward, we will need to think about ways to incorporate this flexibility into our scheduler tool.
Overall results: Out of 27 expected schedule items, our participants planned correctly for 8 of them. This is about a 30% correct rate, much lower than our expectation of 80%.
EXPERIMENTS 2 & 3


For our second and third experiment, we utilized the following our account already had from the previous intervention study, as well as any classmates who chose to follow the account after we shared the link with the class. We conducted it this way because, due to the nature of the experiment as measuring how often people naturally read what they scroll past on Instagram, we did not want those involved in the experiment to know what we were measuring or pay any more attention to our posts than they would have otherwise. We mentioned to classmates and followers who asked that we would be conducting a test for 3 days, but did not provide any details in order to get the most natural actions on their ends. These followers and classmates were also ones who tended to be more active on Instagram and thus more in line with our Social Sally persona.
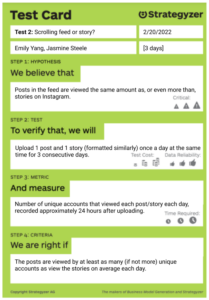
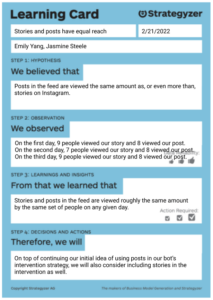
For these tests, we relied on Instagram analytics. For test 2, we were trying to see if posts or stories got more views. Our story views from days 1-3 were 9, 7, and 9, and our post’s accounts were 8, 8, and 8. This was about the same – people viewed Instagram stories and posts with the same frequency.
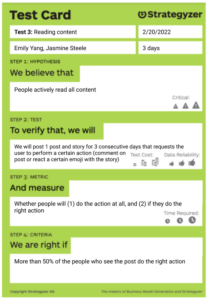
For test three, we had the following results:
(See our detailed Instagram analytics screenshots here)
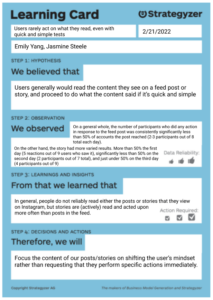
- Day 1/post 1:
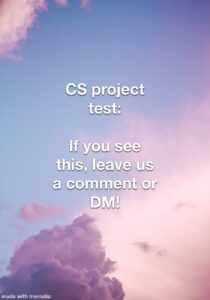
- 3 comments on post 1 (out of 8 accounts reached)
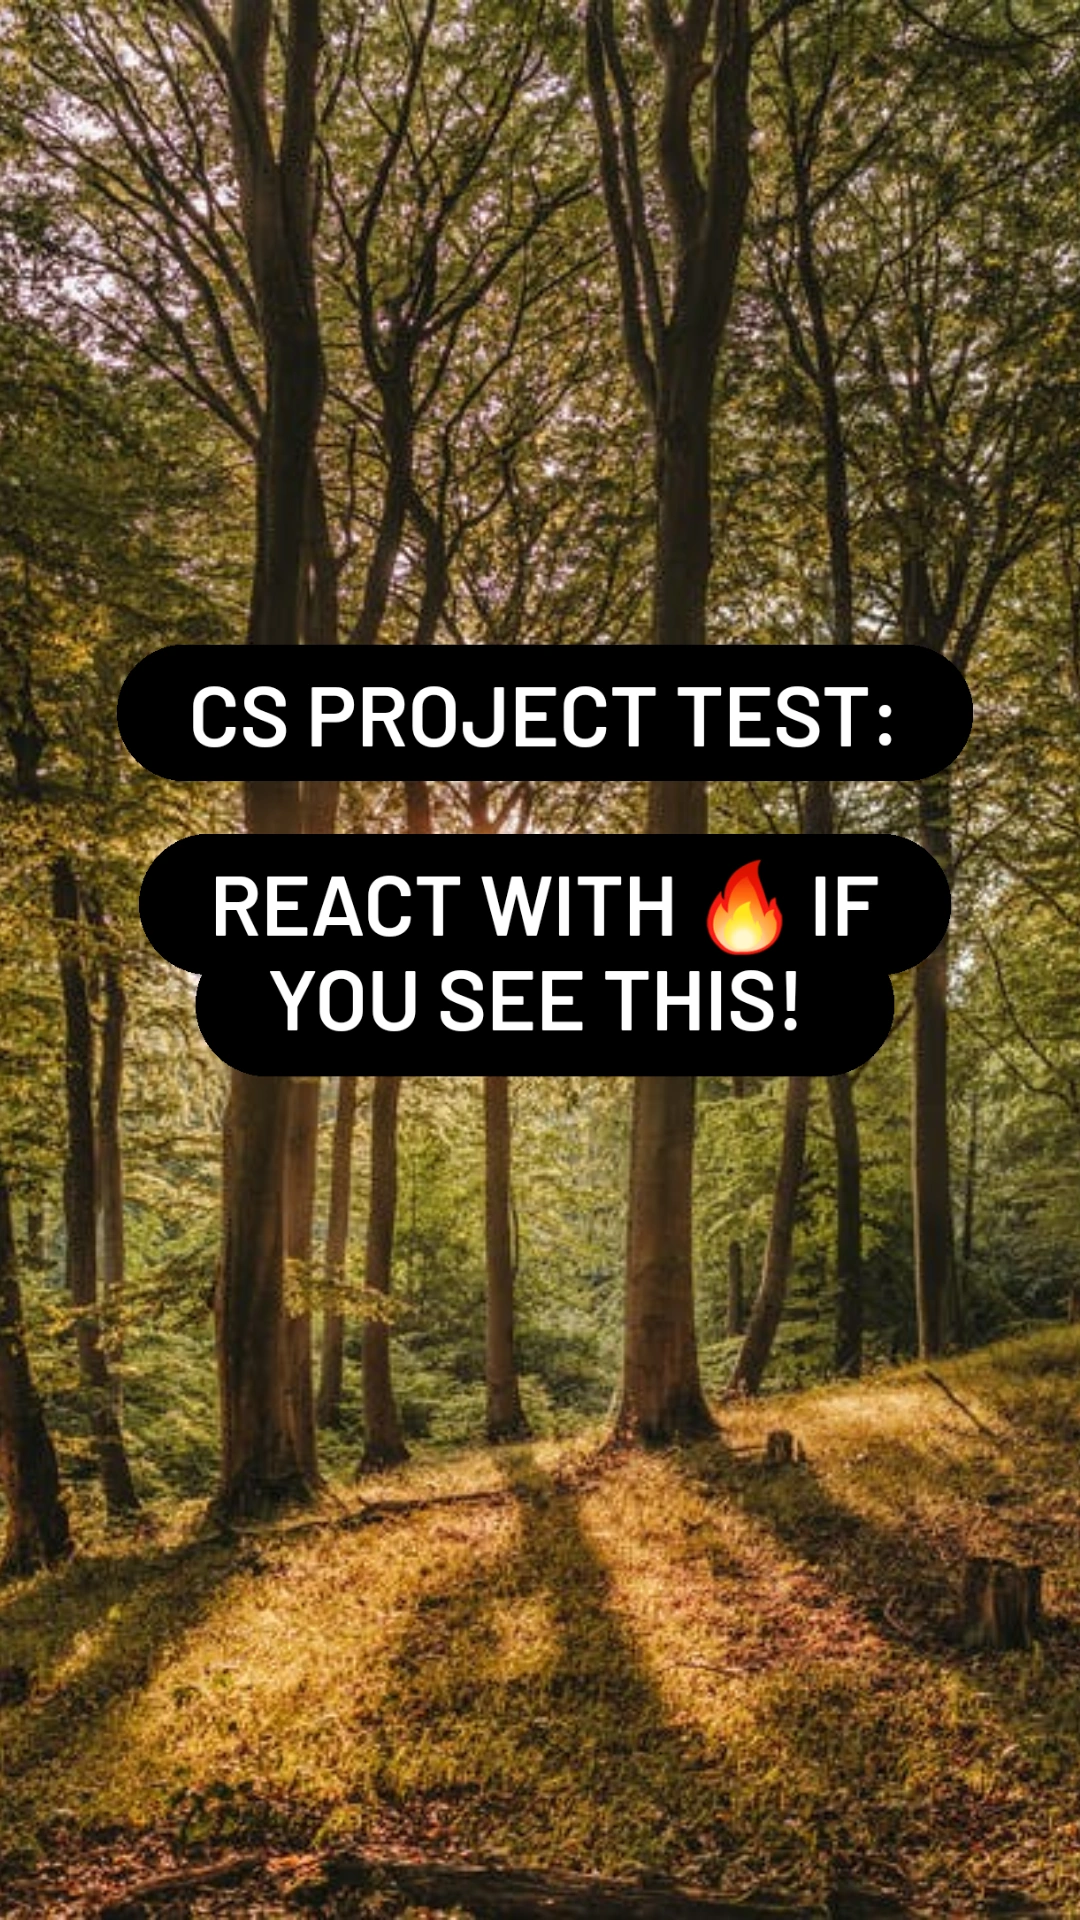
- 6 people react to the story correctly (out of 9 story impressions)
- Feed post less than 50%, story reaction greater than 50%
- Day 2/post 2:
- 3 comments on post 2 (out of 8 accounts reached)
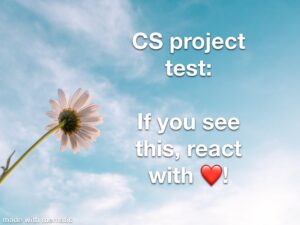
- 2 people responded to story -> responding with name (out of 7 story impressions)
- Both feed and story were less than 50%
- Day 3/post 3:
- 2 likes on post 3 (out of 8 accounts reached)
- 4 correct reactions from story, 1 reaction but incorrect reaction (out of 9 story impressions)
- Both feed and story were less than 50%
This tells us that less than 50% of people who see the post do the right action.
Comments
Comments are closed.