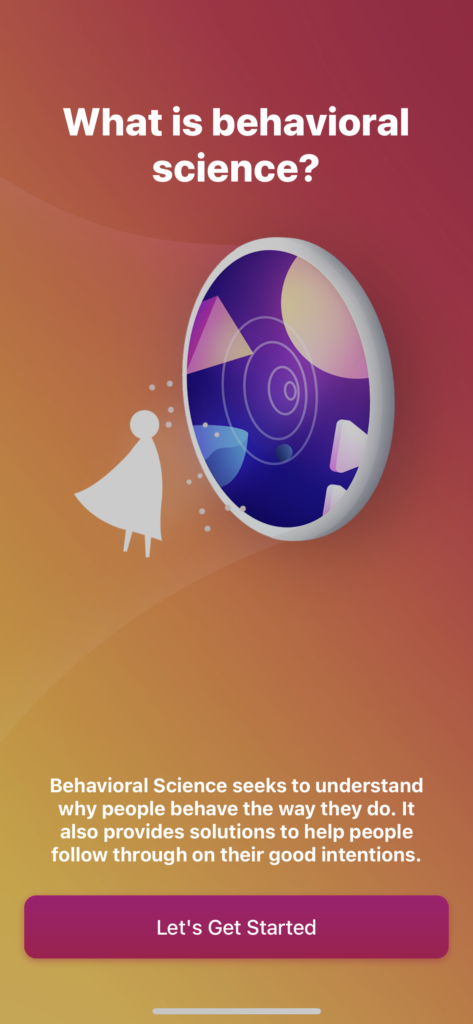
Our team is designing an app that incentivizes gen Z to build good habits with progressive rewards. A user that wants to read more, for instance, could add a new stroke to an increasingly complex painting each time they finish a book. As they build their reading habit, the painting becomes more beautiful and intricate, motivating them to see what else they could make if they stick to their habit. To build revenue, we will capitalize on in-app purchases or microtransactions. Users could pay to unlock new types of progressive rewards or print their progressive reward on a t-shirt, tote bag, or sticker.
We arrived at our solution based on several user interviews. I interviewed two gen Zers: a female 6th-grader from Texas and a male frosh at Stanford from New Jersey, both users of mobile devices. Both of my interviewees considered novel, abstract, enduring rewards to be the best motivators. For instance, the 6th-grader discussed how her teachers reward student participation with Jolly Ranchers, so much so that she’s tired of the candy. In her reading class, however, each time a student completes a book, they get to add a link to a colorful class chain that grows longer and more complex throughout the year. The idea of adding a chain to a link is a much stronger motivator since none of the students know what the chain will look like, and the only way to make the chain look cooler is to read more books! The Stanford frosh that I interviewed reported being motivated by another novel reward: money. The novelty of being paid, according to him, is that you can spend your money on whatever experiences you’d like to have. His perspective introduces the idea that autonomy over one’s rewards can also be a motivator: perhaps users could be excited about the fact that their progressive painting is unique from their friend’s progressive song even though both people are being rewarded by our app.
Below is an analysis of our potential market size:
TAM – Total Available Market
$143.6 million = Total U.S. population * percentage of individuals with smartphones in the US * percentage of mobile app users that conduct micro-transactions (in-app purchases) * per unit microtransaction
- Total U.S. population in 2022 (according to U.S. Department of Commerce) = 332,403,650
- Roughly 90 percent of the country’s population has access to a smartphone
- Around 5 percent of users make in-app purchases
- Average of $9.60 per app in-app purchases (per month, but ignoring that and treating it as a one-time transaction)
SAM – Served Available Market
$29.4 million = Total Generation Z population * percentage of individuals with smartphones in the US * percentage of mobile app users that conduct micro-transactions (in-app purchases) * per unit microtransaction
- Total Generation Z (aged 10-25) population in 2022 = 68 million
- Roughly 90 percent of the country’s population has access to a smartphone
- Around 5 percent of users make in-app purchases
- Average of $9.60 per app in-app purchases (per month, but ignoring that and treating it as a one-time transaction)
SOM – Serviceable Obtainable Market
- Stanford undergraduate students and new grads (in the past two years)

