Divert is an app that seeks to reduce screen scrolling through gradual visual and audio distortion. Many students struggle with seemingly endless doom scrolling sessions on addictive apps like TikTok and Instagram. While companies like Apple enable phone users to attempt to reduce this time by locking apps after a set time period, these settings are easily overridden. Divert instead gradually decreases the attractiveness of the screen and targets specific applications that cause users issues. In our research, we found that visual distortions such as grayscale can assist in this problem, and Divert integrates multiple features to discourage users from continual phone usage.
Problem Finding
We were excited to work on a problem that directly affects many of our peers. Apps like TikTok and Instagram played such integral roles in our childhood and adolescence, that it’s hard to imagine life without them. Consequently, many people our age have dealt with the negative effects of smartphone overuse. Our literature review revealed that university students who use their phones for over 30 minutes before bed experience significantly lower sleep quality. We also learned that certain interventions can be helpful. A study that involved switching smartphone users’ display to grayscale led to a 40-minute reduction in screen time. Experiencing smartphones in black and white instead of color can limit the dopamine rush that usually comes with phone use.
Competitors:
We aren’t the first team to try to help users lower their screen time. Our competitors are helpful in some ways but fall short in others. Consider the Apple iPhone screen time limit features. While these limits are easy to set up, it’s hard to stick to them since it’s easy to simply click the “ignore” button when the notification appears. We also investigated other apps such as “One Sec” and “OffScreen.” Even though our competitors offered interesting features such as detailed data regarding users’ screen time, they fell short in terms of customization, affordability, and long-term user interest. The biggest issue we found was that users were looking to limit screen time for all kinds of apps, not just the select few anticipated by our competitors. Click here to see our comparative research in more detail.
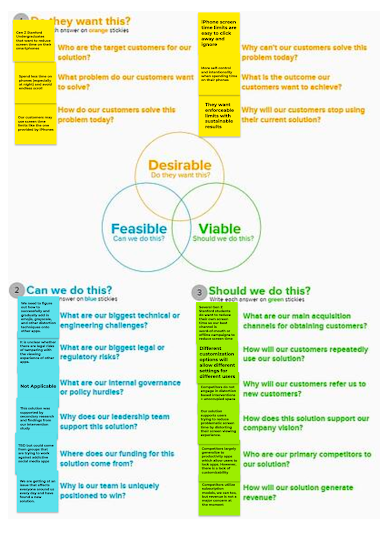
User research:
To learn more about our users’ needs, we conducted a baseline study on our target audience: Stanford undergraduates aiming to reduce their smartphone usage. The study involved pre and post interviews with a 5-day study in between in which participants reported their most fulfilling activities. We also collected the participants’ screen time data for those 5 days. Our interviews focused on users’ perceptions of high vs low screen time as well as what activities they’d like to experience more in their lives. We decided to monitor these questions and activities to understand why participants wanted to reduce their screen time and what activities were compelling enough for participants to put down their phones.
Findings:
The baseline study demonstrated that participants often turned to their phones when they were alone. It was too awkward for them to simply stand in line or sit in the dining hall alone while waiting for a friend, for example. Additionally, after coming back from spending time with friends or going to class, participants went straight to checking updates on their smartphones. We learned that people wanted to take advantage of their alone time for hobbies and relaxation rather than scrolling through apps like TikTok. Overall, we realized that our target audience had a multitude of ways to occupy themselves when off their phones. We narrowed down the main issue to the hardest part of the process: it can feel impossible to come to a stopping point when mindlessly scrolling.
Personas & Journey Maps
To synthesize and better-understand our findings, we created two user personas: Relaxed RJ and Night Owl Nick:
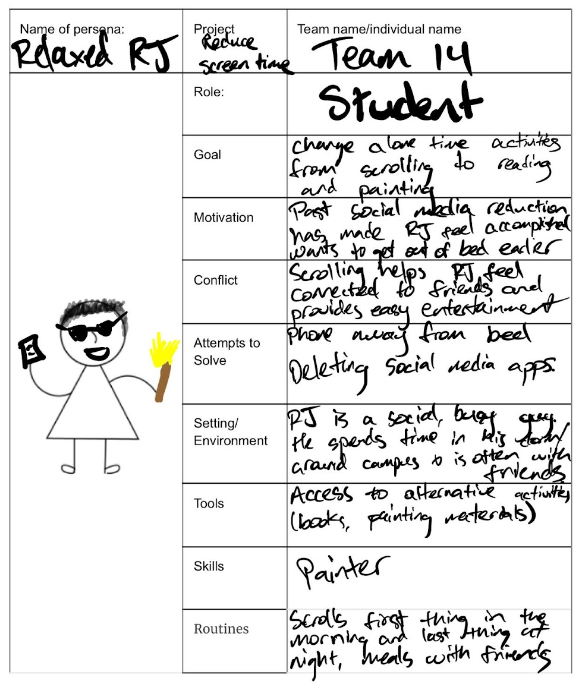
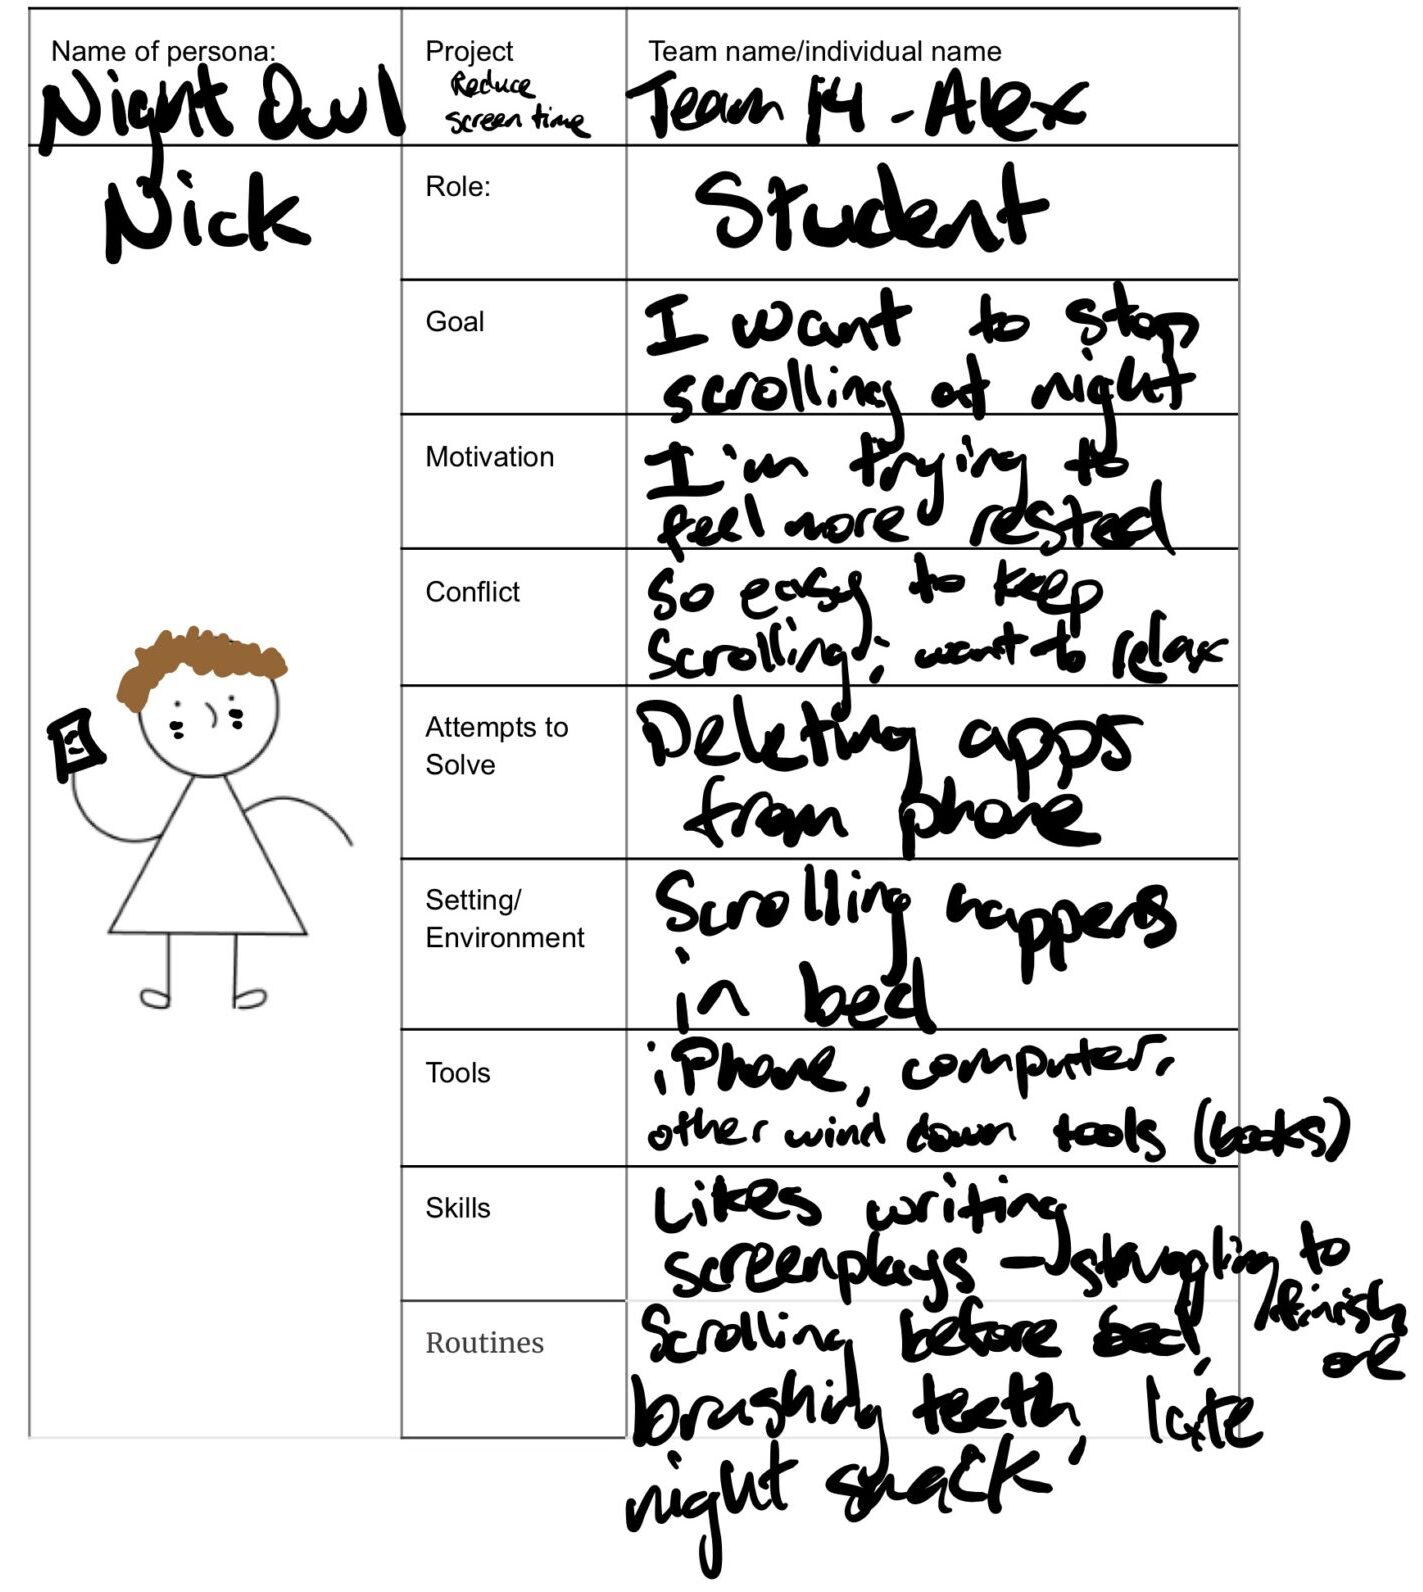
The first aims to spend their alone time relaxing outside of smartphone use and the other wants to stop scrolling before bed. We chose to focus on these two personas because we wanted to help users with very different needs. If we could come up with a solution that helps people scroll less when chilling alone during the day and before bed, then our solution could help a diverse array of people at virtually all times of the day. For each persona, we made journey maps to reflect their actions and emotions throughout the day:
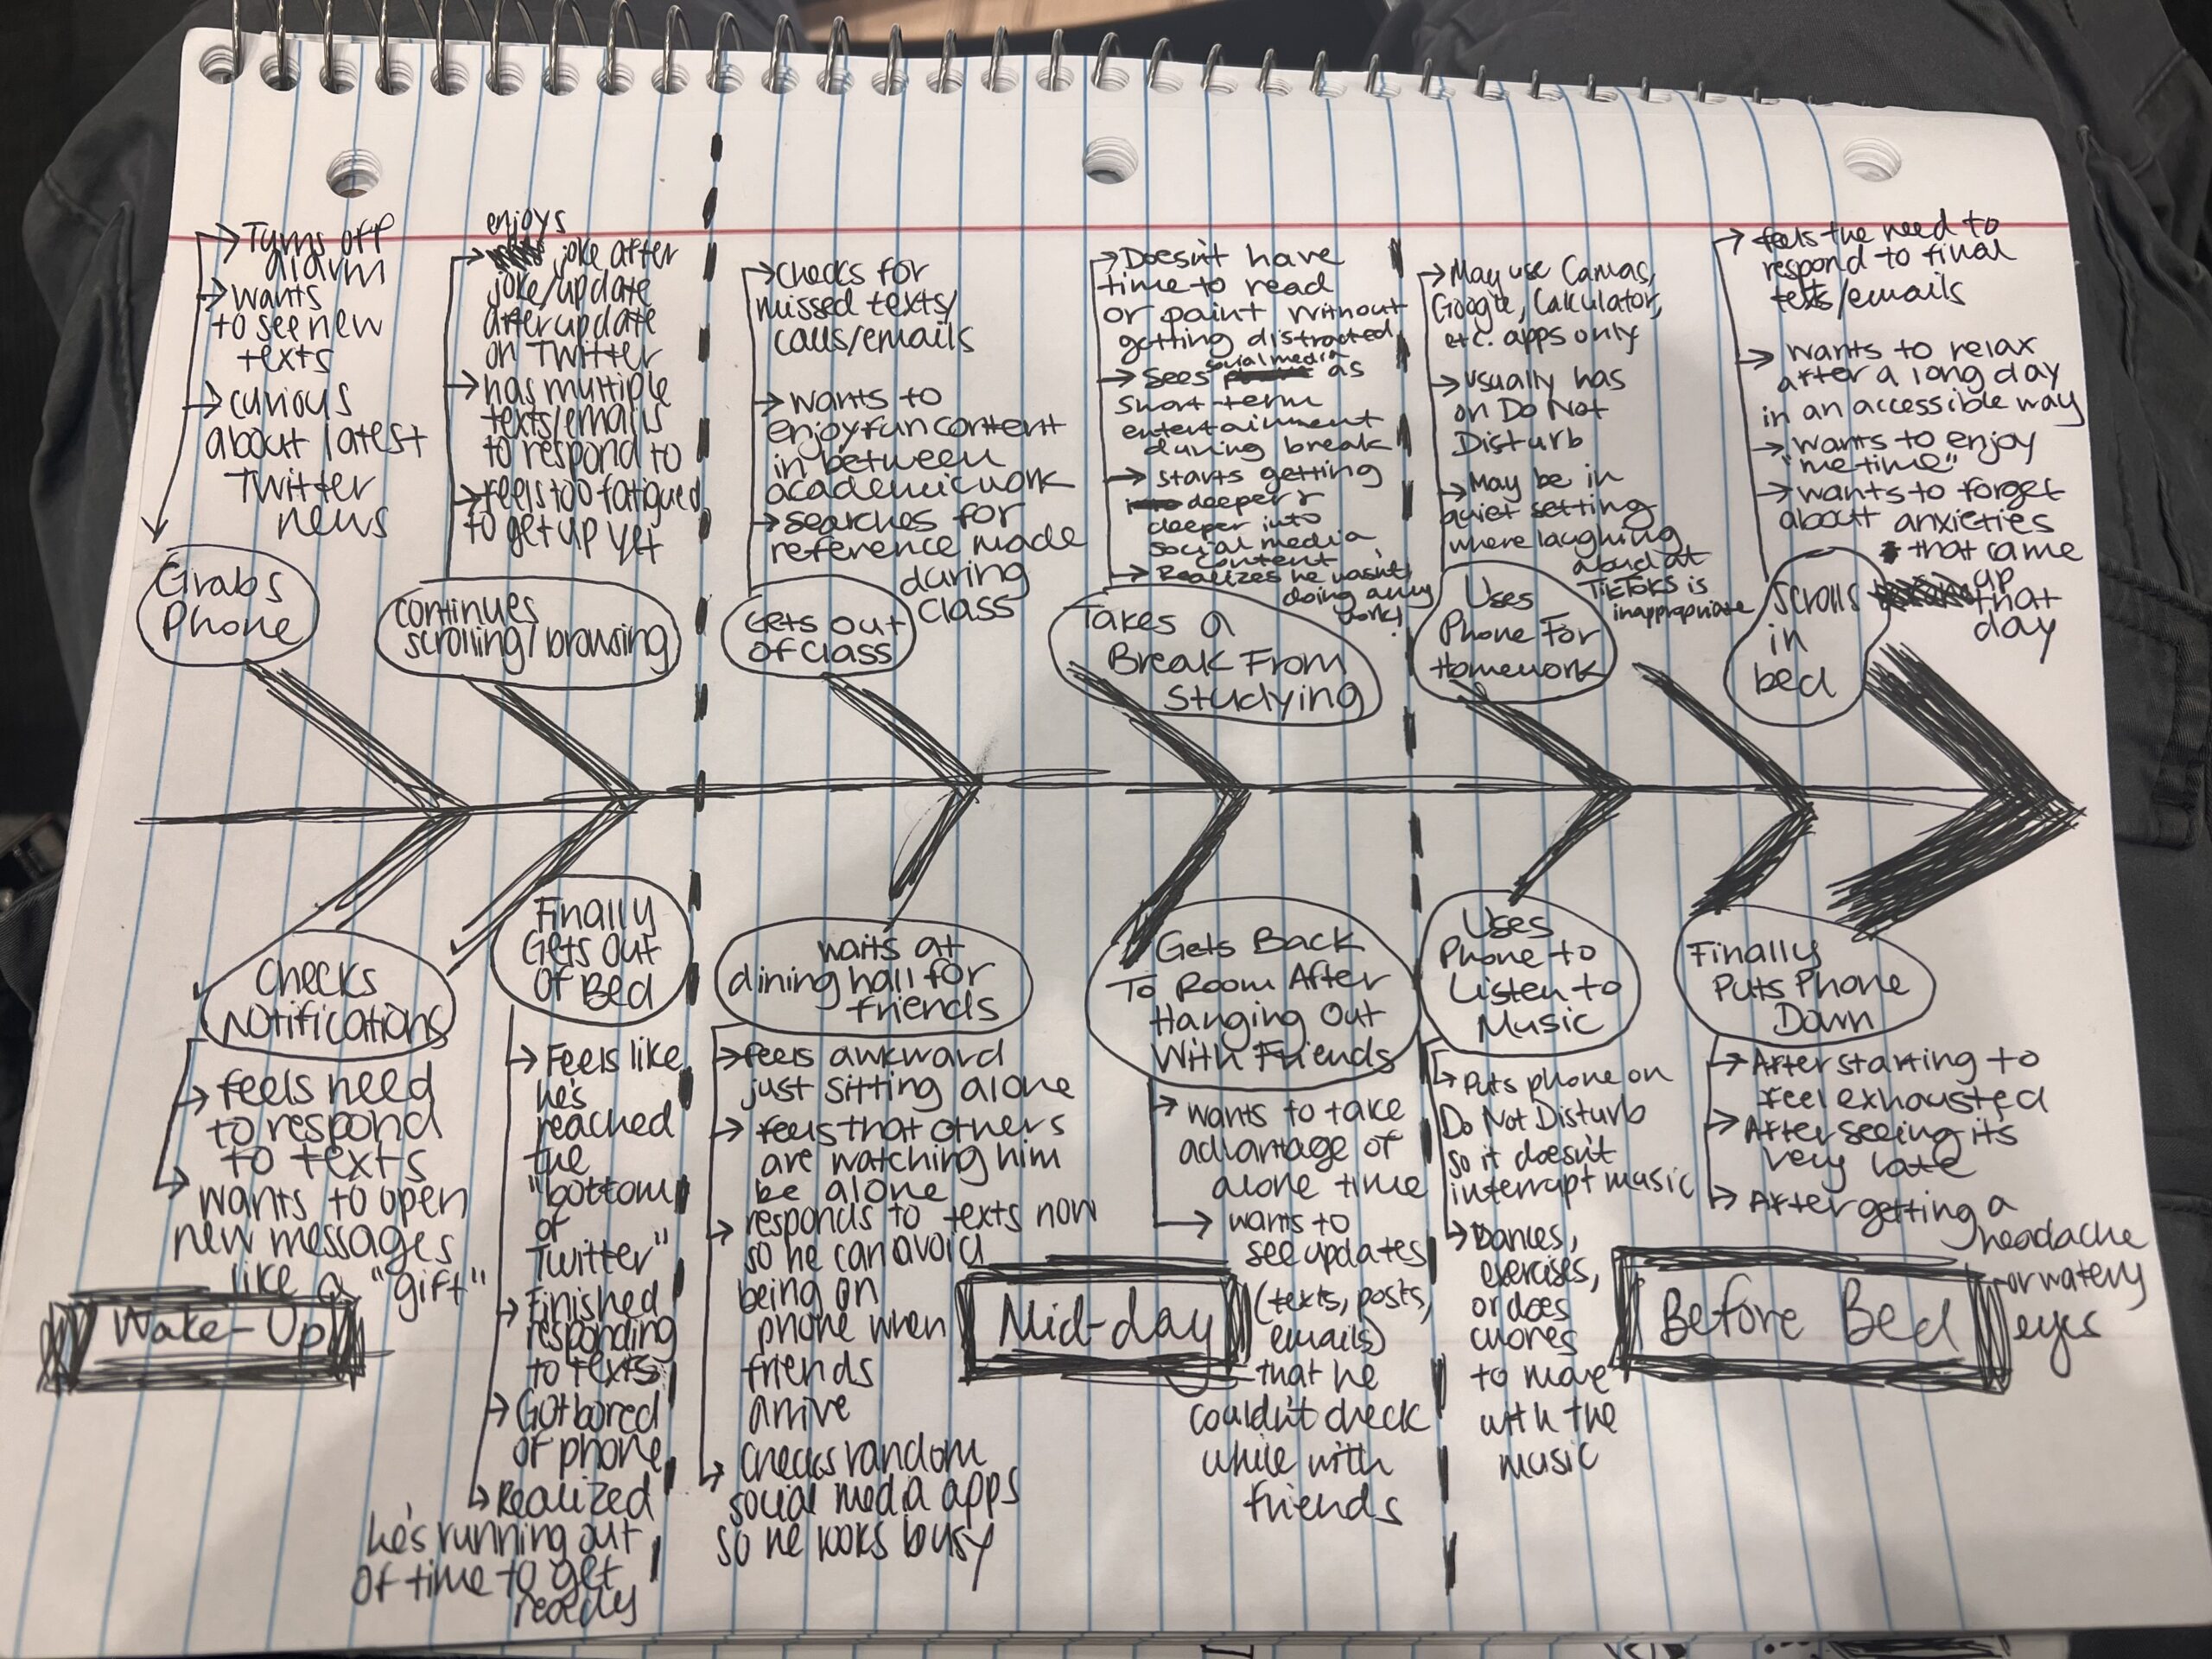
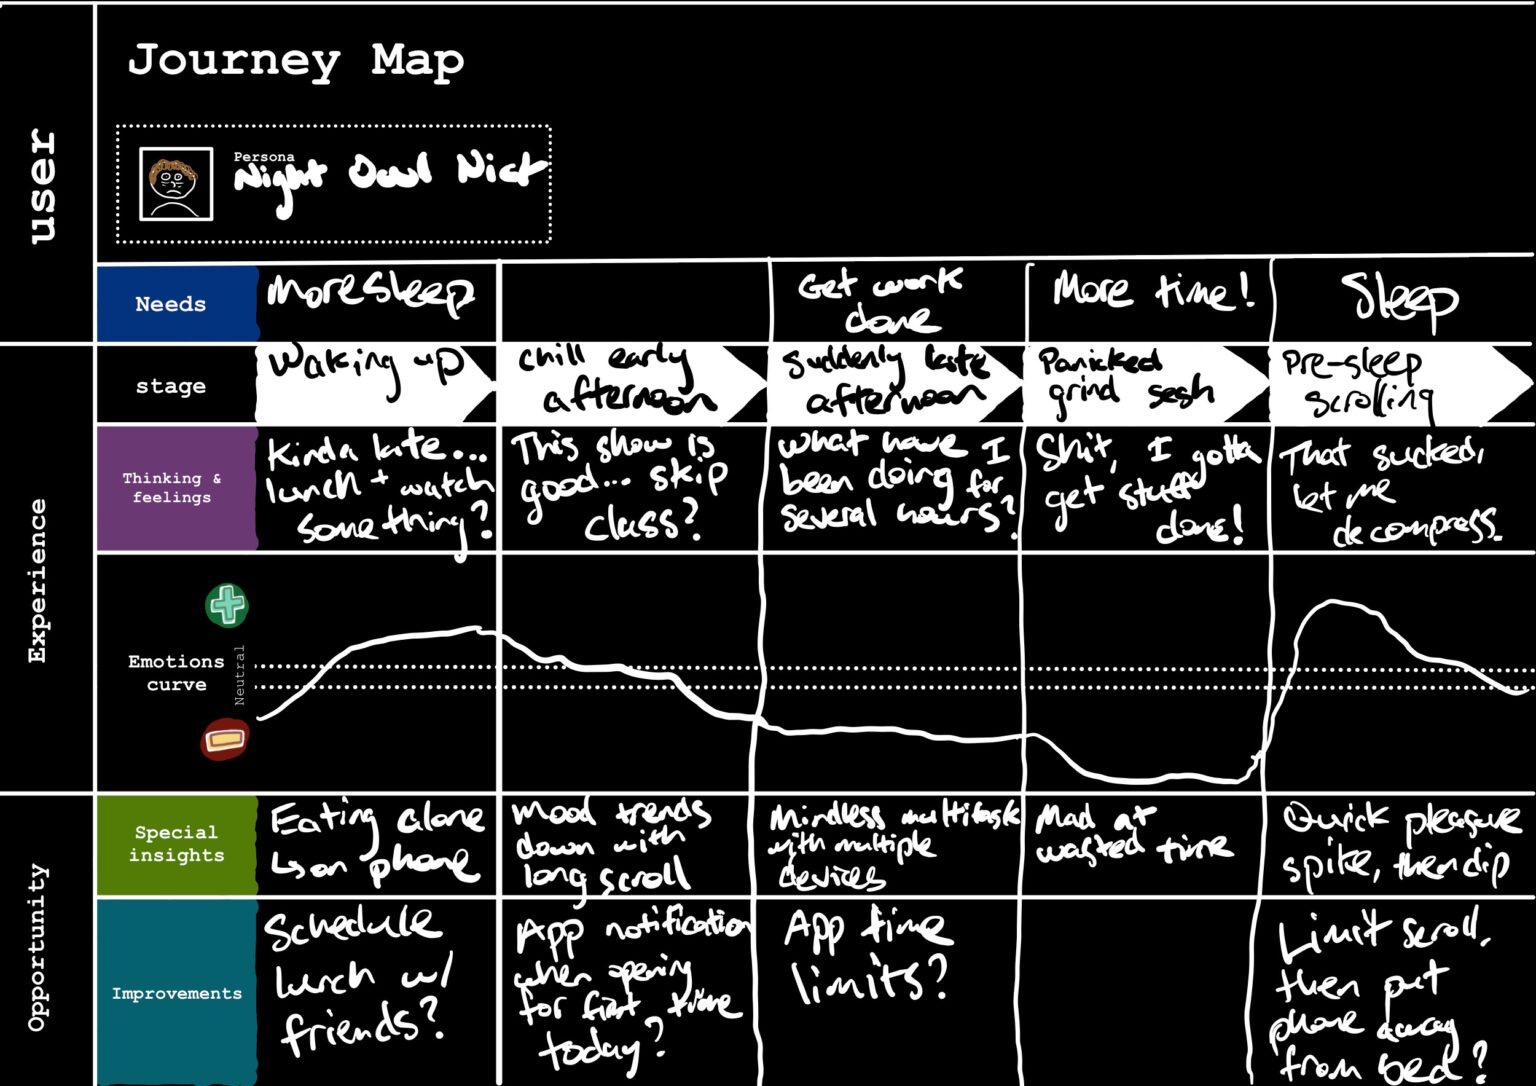
Click here to learn more about our personas and journey maps in detail.
Solution Finding
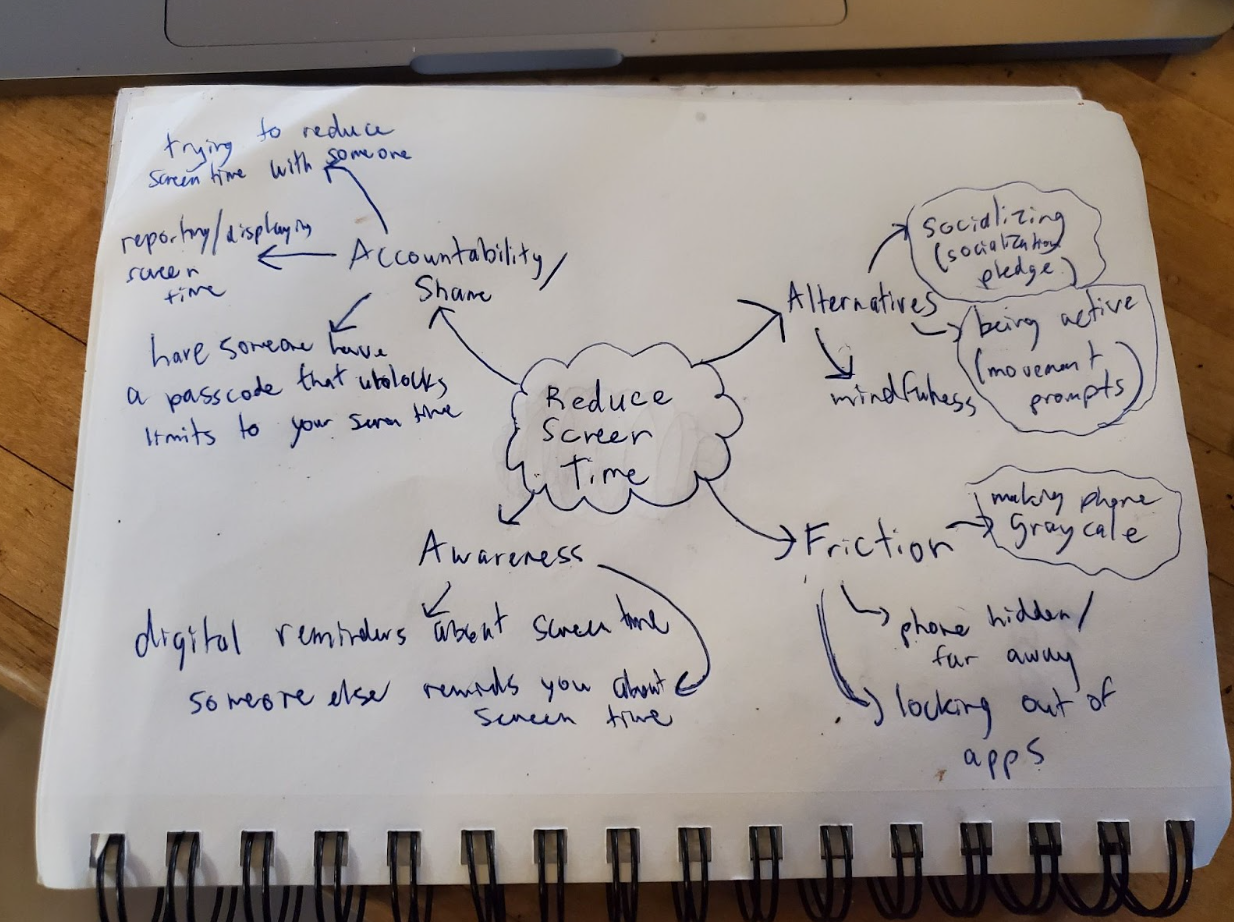
We ultimately landed on our final solution through a thorough user research process that included an intervention study, synthesizing through bubble mapping and system path diagrams, and some assumption mapping and tests.
Intervention Study
For our intervention study, we carried out two intervention tests, targeted grayscale and password protect studies. In the first, we sent our participants text reminders in the evening to turn their phones on grayscale and in the morning to turn their phones off of grayscale, testing how much their screen time was affected by having their phone on grayscale at key points of the day. In the latter, we had participants set a time limit on one key app at half of their usual screen time and give a password to unlock that screen time to a friend, testing whether people would be dissuaded by social pressure when trying to exceed their screen time limit. We originally had 4 ideas for interventions – for a detailed discussion of all four intervention ideas and why we settled on these two intervention ideas, please take a look at the “Discussion and Choosing an Intervention Idea” section of this blog post. For the detailed protocol and research questions for the intervention studies we carried out, take a look at the “Intervention Study Procedure” section of the post.
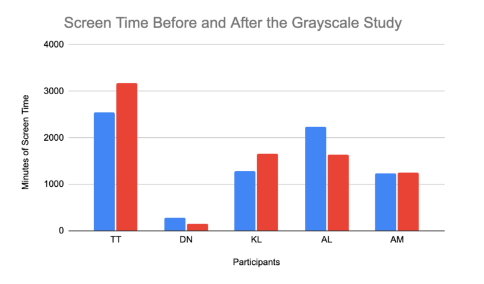
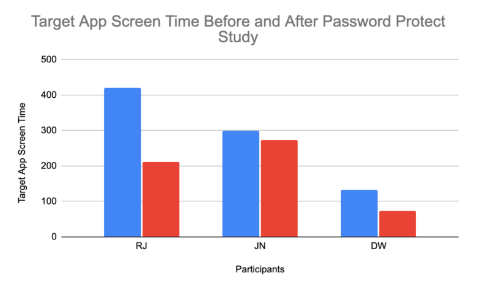
From our intervention study, we gathered several key insights. Read the “Intervention Study” of our midterm write-up for a more detailed rundown of our takeaways. Overall, though, the password protect study decreased screen time significantly throughout, while the grayscale study was inconclusive, as the screen time of some increased while other times decreased. For the grayscale study, we learned that certain apps feel weird to users on grayscale (Wordle, maps, facetime, etc.) and people often opted out of grayscale when it interfered with their necessary functions on apps like Calendar or Maps, so it would be good if grayscale was only specific to apps that are time-sucks. For the password protect study, we found that even having the reminder was helpful to reducing screen time which was a useful insight. Additionally, we found that the social pressure of asking for a password was very real, causing people to be conscious about avoiding exceeding their limit. As a result of this study, we decided, for our final solution, grayscale and other distortion effects should be targeted at specific apps and should include some form of a reminder of users’ progress on screen time. However, ideally, knowing what we know now, our intervention study could have been even more useful to our final product if we intervened using different types of distortions to see which types are most effective, figured out how to do our social pressure test without the loophole, or learned how gradually interventions should set in.
Design Architecture and Synthesis
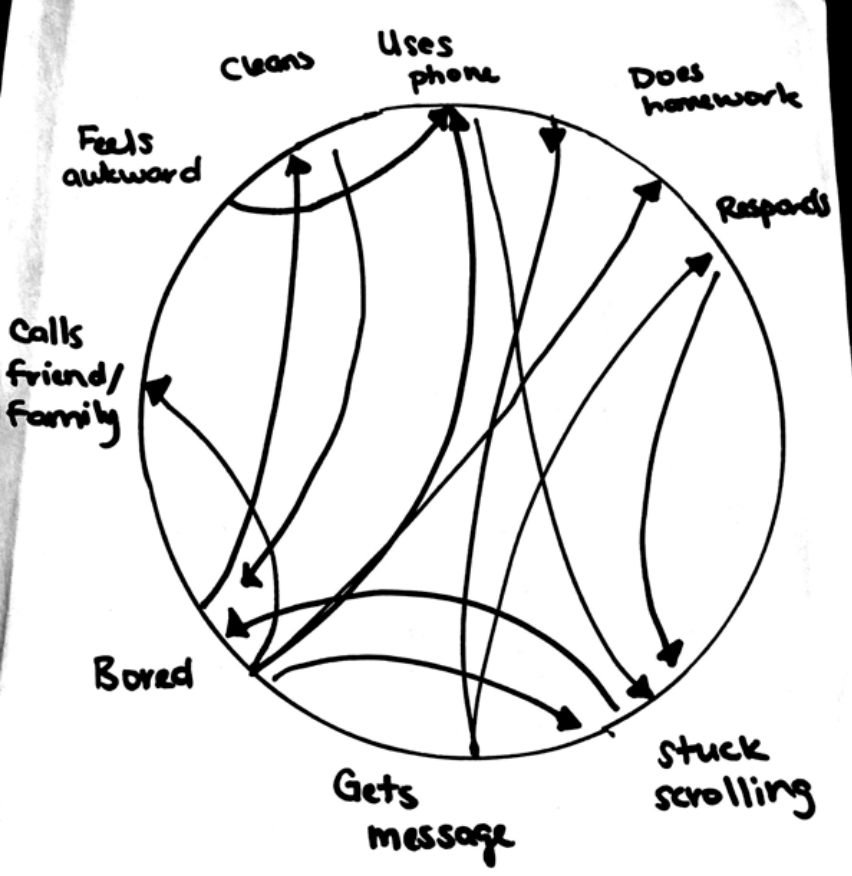
Throughout the synthesis process, we created a system path and a bubble map to help us come up with our design architecture. Read this post for more information on these diagrams and the whole architectural design process for our solution.
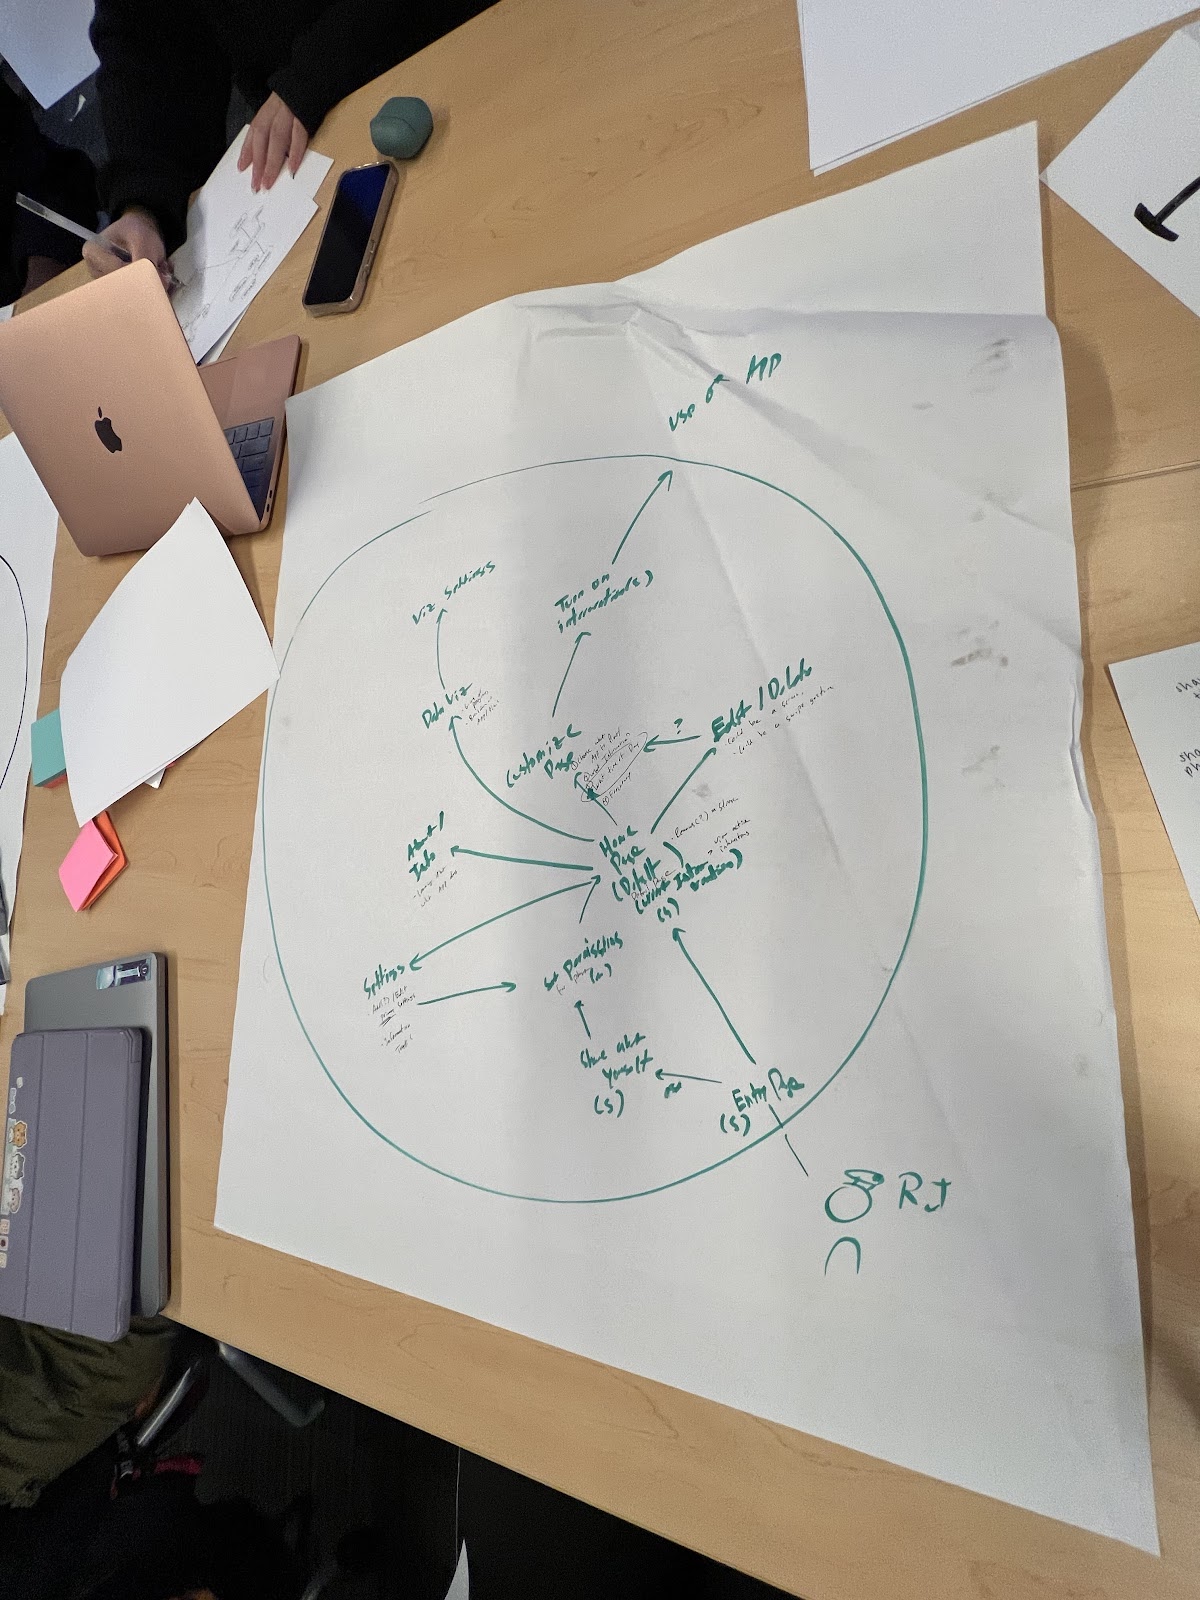
First, for our system path diagram, our main learnings were that it might be useful for users to have an onboarding process, a home page with a lot of room for customization of interventions and other settings, and that different users might have different preferences for intervention times. Overall, it led us in a direction that focused us on an easy navigation and very customizable process.
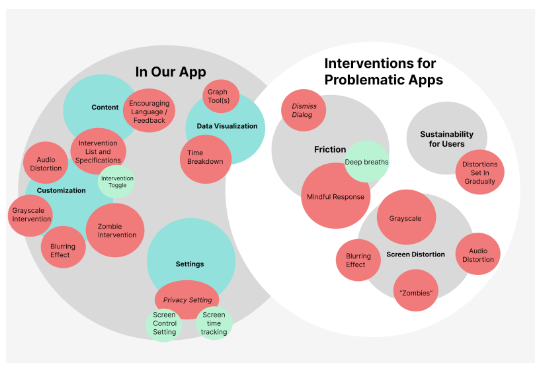
Our bubble map meanwhile really helped us break our app into the key components of components that occur within our app and within the problematic app, a delineation that was helpful as we were coming up with our final product. Additionally, it helped us gather all of our insights into the synthesized finalized components we wanted to include like all of our different customization options for screen distortions, different modes of creating friction for the user, and data visualization. Overall, the process of mapping was useful in guiding all the details we needed to create the most effective app at reducing screen time.
Assumption Mapping & Testing
Although we had synthesized our findings into potential solutions, we realized that they were relying on making some assumptions about our user and product. Therefore, the next step that we went through was assumption mapping. Read this post for more details about our assumption mapping and solution-finding process.
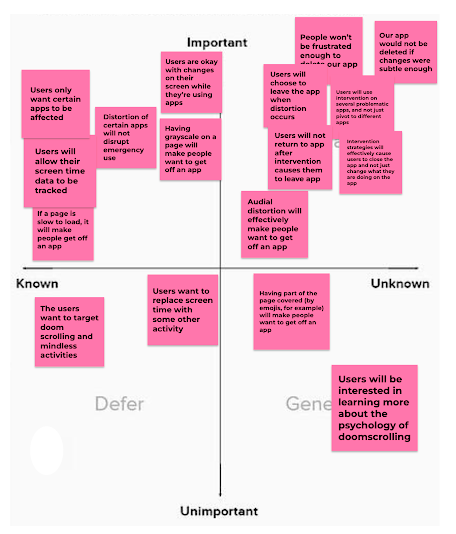
From this assumption mapping, we realized that our 3 most important assumptions were:
- People won’t be frustrated enough with the disruptions/distortions to delete our app
- Users will choose to leave the app when the distortion occurs
- Users won’t return to the original app or switch to a similar app after disruption/distortion causes them to leave the app of focus
We tested these assumptions by carrying out 3 different assumption tests:
- Distortion With Grayscale Test – we had users turn their phones on grayscale after they reached their screen time limit and saw how it affected their screen time
- Airdrop Test – we spammed users with photos via Airdrop to see how long it took them to get off of an app
- Movie Persistence Test – we had users watch a long video while gradually adding in distortions to the screen
This document details the procedure for each of our assumption tests. Read this post to learn more about our experiments, including our testing and learning cards for each of these assumption tests.
We gathered several useful insights from our tests. From the grayscale test, we learned that a user-initiated distortion won’t work since users avoided turning on grayscale themselves, leading us to choose to trigger distortions automatically. From our airdrop test, we observed that, although distortions were effective at getting people to leave a certain app, they would quickly turn to a different app, showing that we should enable users to set up distortions on multiple of their problematic apps to actually reduce their screen time. Finally, from the movie persistence test, we deduced that users would be more likely to leave apps if there were multiple distortions included and they set in gradually within the first 10 minutes of a user reaching their screen time limit. All of these findings led us to shift our overall solution to include many different types of distortions that would be triggered automatically and set in gradually once users reached their screen time limit.
We think it was useful that we had a wide range of assumption tests to play out different scenarios, which revealed insights we did not even expect. Critically, our solution got much more refined after our assumption tests. As a result, it would be useful to test out these same assumptions on our more sophisticated design to confirm that we have solved for the issues identified. After our assumption tests, we are still left with the assumption that users will care about their screen time enough to set distortions and not turn them off within our app when they get frustrated. We can add friction but, ultimately, it is unclear until our app is used in the real world the extent to which people will follow through with it.
Building a Solution
Wireflows to Sketchy Screens
For a detailed look at our mapping strategy with our system path diagram and bubble map for system architecture, please check out our Architectural Design writeup. The main takeaway from our maps was that our happy path would not include any action to turn off an intervention and that intervention creation was an important aspect of our app since all users would be expected to make an intervention. These two insights suggested that the path for deleting or disabling an intervention would be one filled with friction and the intervention creation path would have to be as easy to find and use as possible.
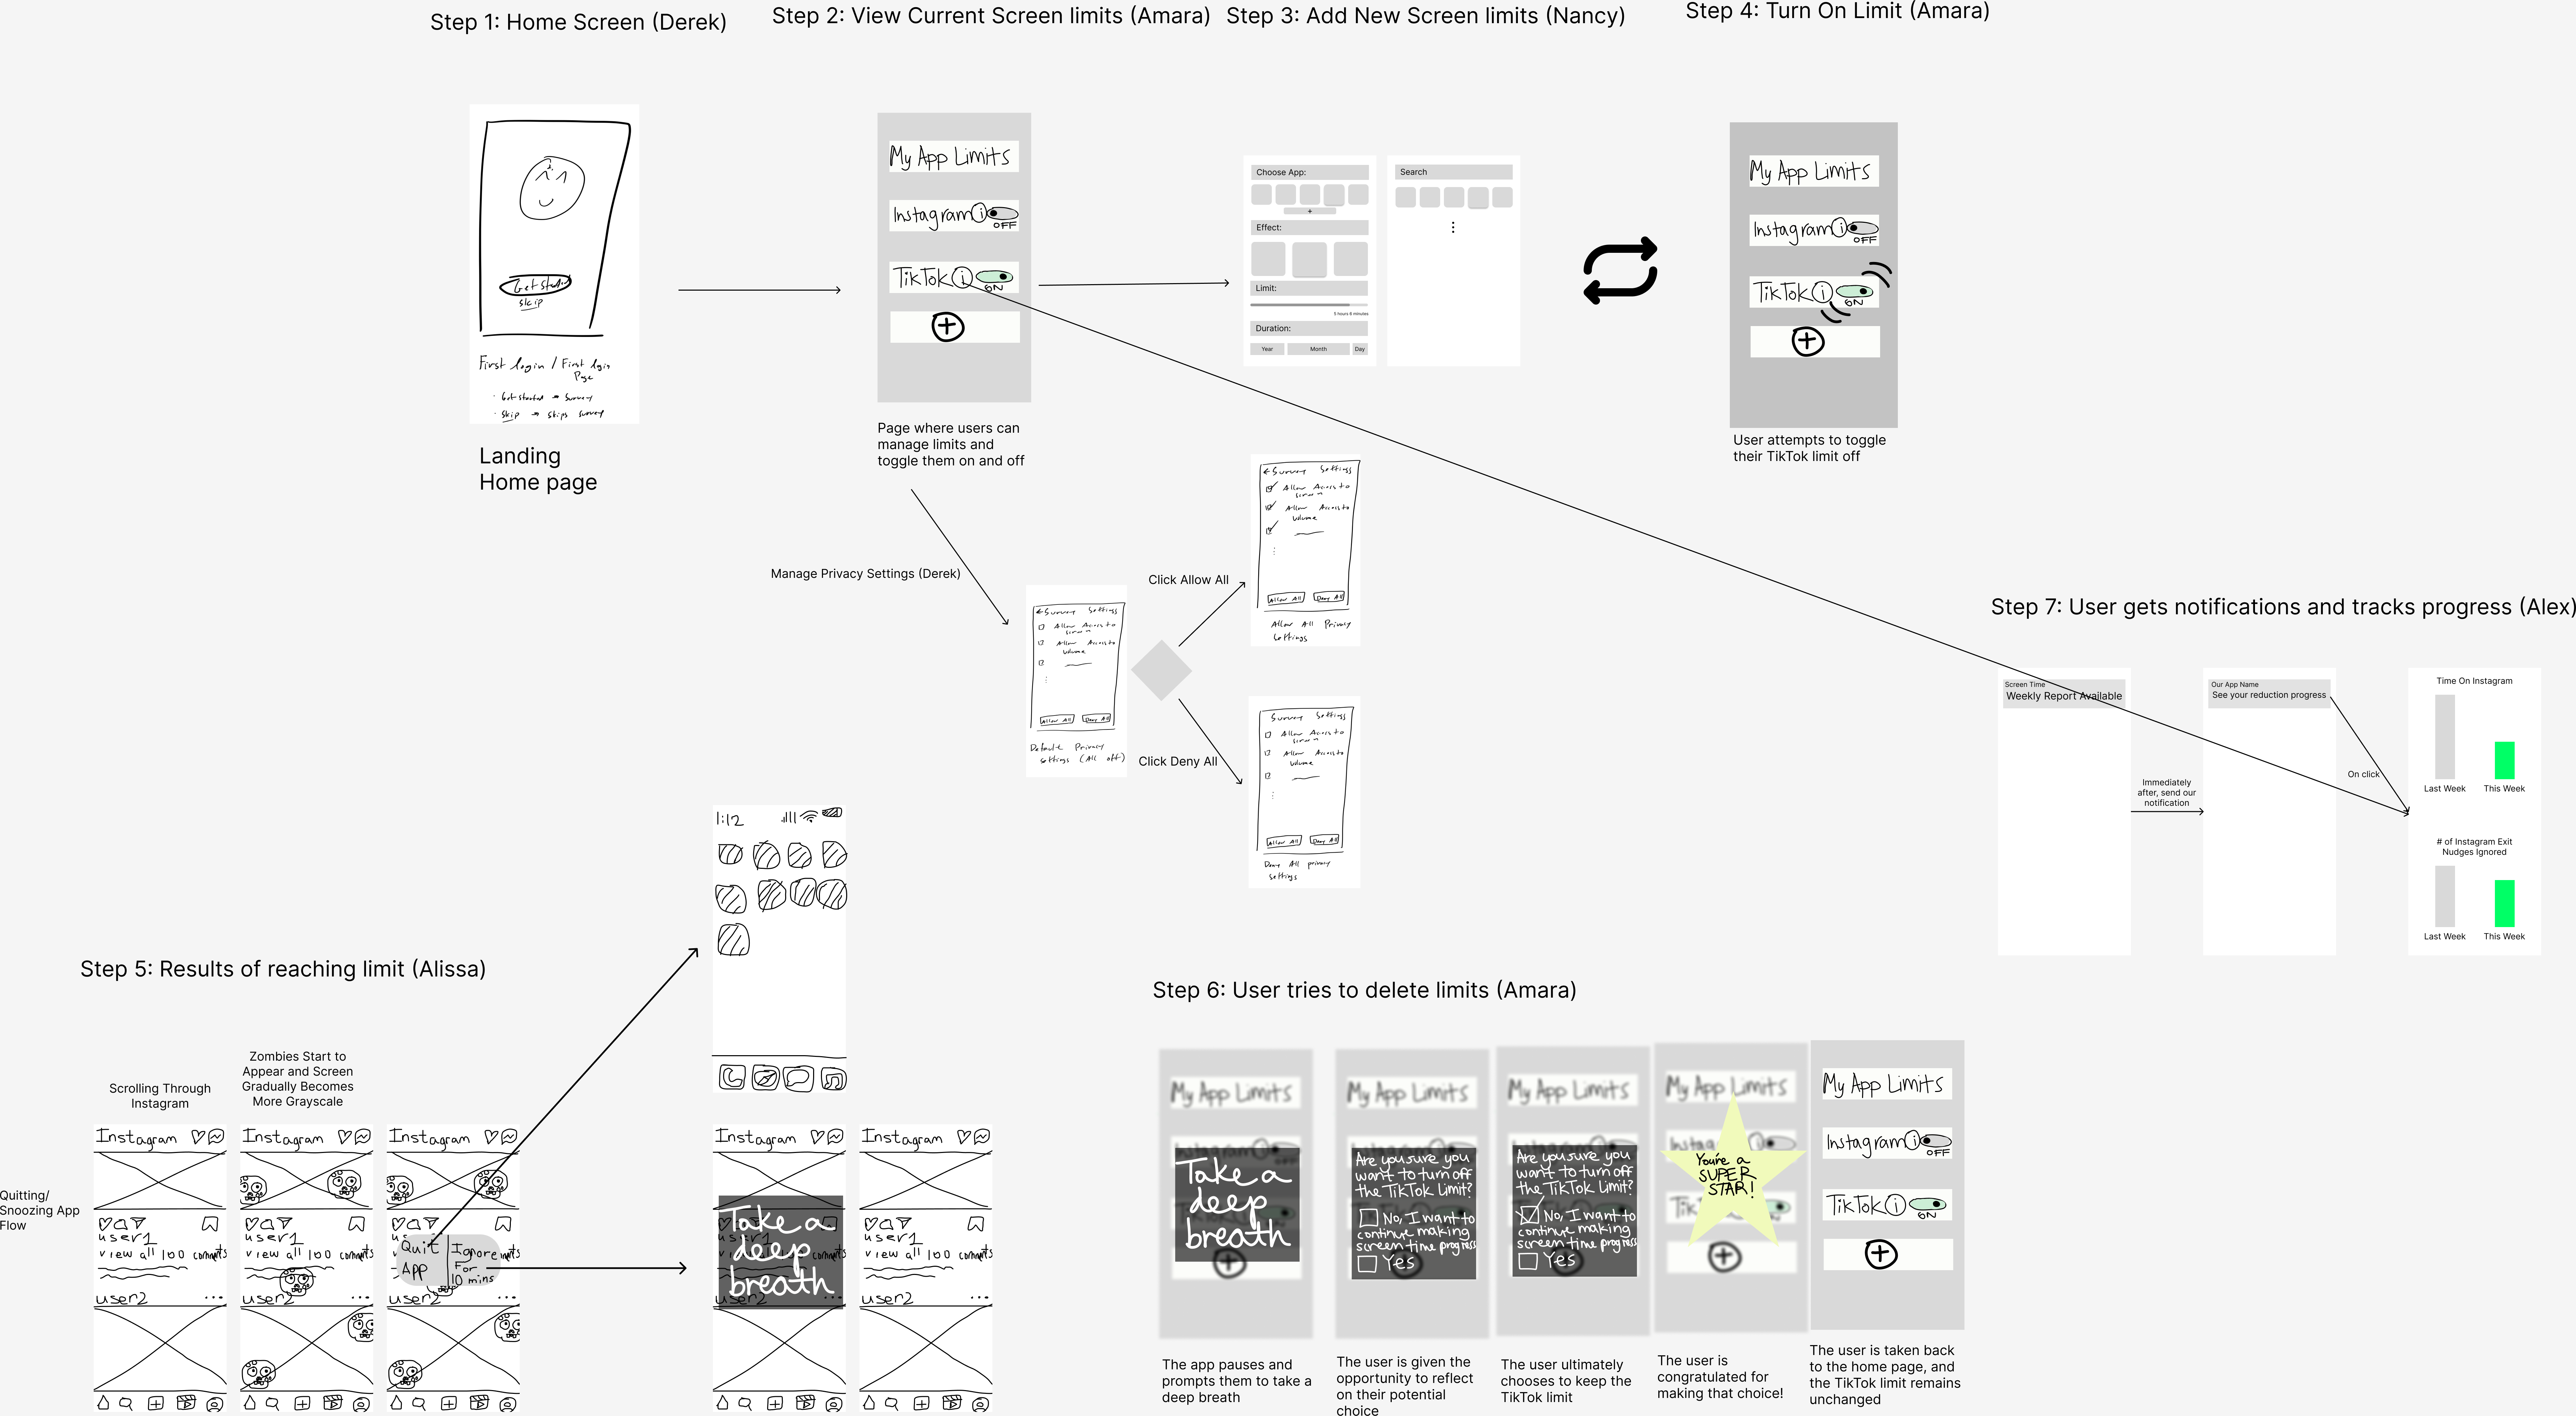
Our finalized app supports multiple flows that a user can engage with. These flows are the settings flow, intervention creation, intervention deletion (or disable), and further viewing of screen time statistics through the use of charts. For a first time user, their happy path would consist of signing up for an account, enabling the relevant permissions for interventions to run on their device, creating a customized intervention for their app(s), and enabling the intervention. A returning user would also follow the same steps besides signing up for an account and enabling permissions (as these steps would be done already).
We achieve our first goal of making the intervention deletion and/or disabling path full of friction through a series of “mindfulness” check screens which prompt the user to think critically and reflect on their decision to disable their intervention. The key point to this flow is that the user has to act with intentionality in order to delete or disable an intervention. We believe that this added an appropriate amount of friction without being manipulative towards the user. At the same time, we also wanted to congratulate the user if they decided that they, in fact, did not want to delete or disable their intervention. By providing positive feedback, we believe that we could encourage users to continue using the intervention.
We achieve our second goal of making the intervention creation process easy to find by including it as a main component in our bottom navigation bar. Since the bottom navigation bar is available in all screens, the user is able to start the creation process from anywhere within the app. Next, we achieve our goal of making the intervention creation flow easy to use through the use of an easily identifiable progress bar at the top of the screen which indicates the user’s progress through the creation process, big buttons for moving between steps, and select buttons that are consistent with existing design patterns for radio buttons. We believe that these UI design considerations make the intervention flow easy to use despite its length.
Branding
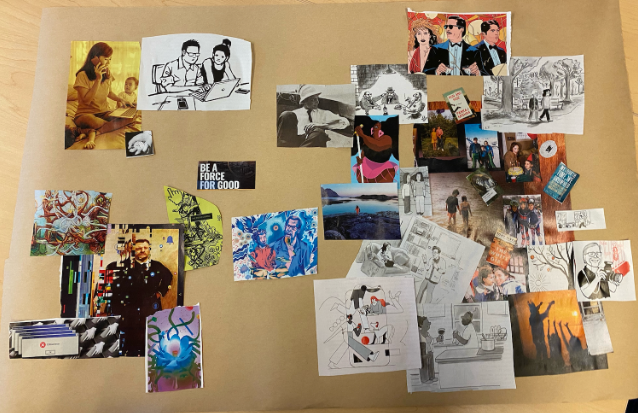
This moodboard describes our process starting from the problem source to the result. We see doom scrolling as an issue, want to change that through distortion, and hope it will result in people doing their favorite hobbies, going outside, and hanging out more.
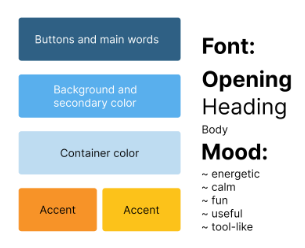
Our goal is to create an app that makes people want to create interventions. We want it to be fun, yet calming to reflect on. We were able to do this by adding stars and encouragement throughout while using colors like neutral blues which are shown to make people feel calmer and more grounded. Lastly, Divert is a tool and we wanted to channel that energy through graphs and charts which were integrated using our color palette and a more basic font choice.
Usability Testing
During our usability testing, we wanted users to accomplish the following tasks:
- Checking your previous screen time data through the app
- Try setting up a specific intervention on one of your most used apps
- Try deleting an intervention
- Set permissions in settings
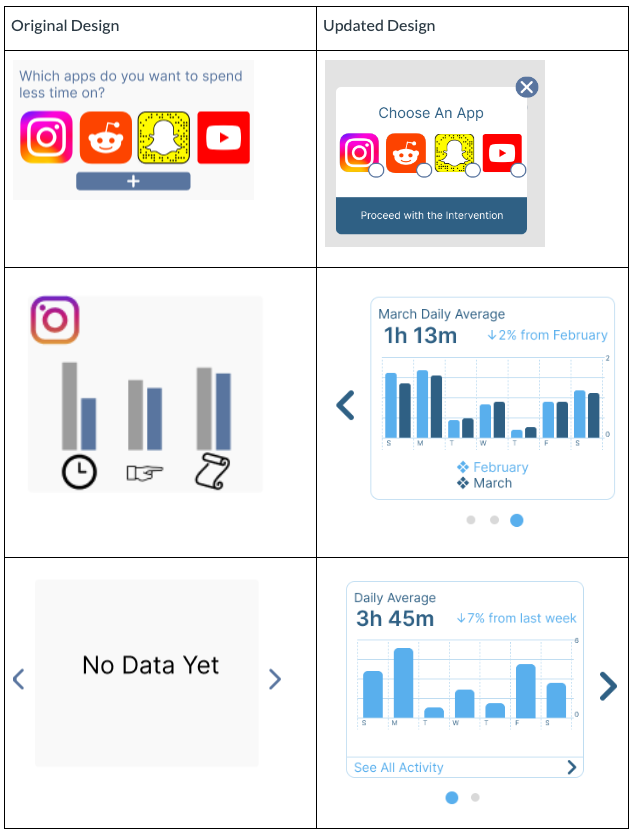
We found that the three biggest issues were:
- Users did not know what app they were creating an intervention for
- Users were confused by the colors and icons for the graphs on the stats screen and could not interpret the graphs
- Users were confused by the home screen and did not understand the purpose of the two components on the home screen.
In order to address the first issue, we added an app selection modal for users to choose what app they would like to create an intervention for. This solved the problem since users would have to select an app before they can proceed with the intervention creation process. To address the second issue, we added labeling to columns of the stats screen charts to make it easier for users to see what each column in our chart was representing. Additionally, we added more forms of data visualizations with relevant labeling to give users a better understanding of their screen time usage. For the third issue, we decided that the prototype flow would consist of a screen with charts and app interventions already present when the user first logged in. By populating the screen with more information than an empty box, users are able to better understand the purpose behind our app.
For a report of some other usability issues that we found, please check out our usability report.
Another thing that we would look into would be allowing users to create and share their own interventions and adding multiple interventions to activate on the same app at the same time. We think by allowing users to decide how to create their own interventions, we can support many more people and situations than we can with just the interventions that the scientific community (grayscale) and we can find and implement (spider from TikTok trend). Additionally, the implementation of multiple interventions at once was discussed in our team, but was not fully realized since we didn’t really understand what would happen with multiple interventions happening at the same time and potentially having interactions interact with each other (grayscale and blur). More research about overlapping interventions would be a good direction for furthering this aspect of screen limitation research.
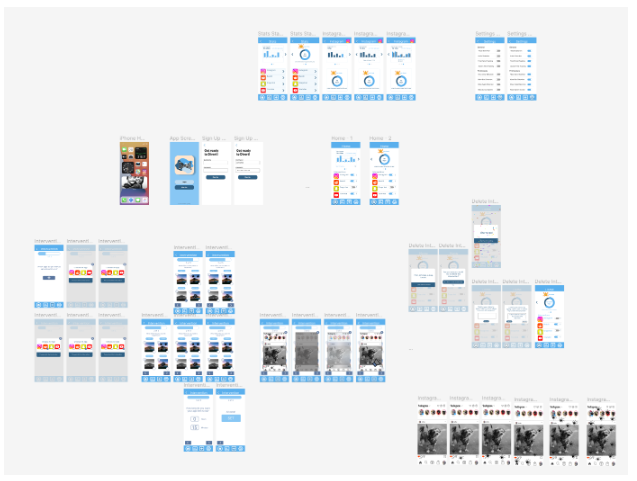
Prototype
Divert Prototype: https://tinyurl.com/divert-app
In our prototype, we implemented a single flow where all screens are connected. Within this single flow, we allowed users to explore multiple different flows such as the onboarding flow, settings permission flow, intervention creation flow, intervention deletion or disable flow, and the stats viewing flow.
Onboarding Flow:
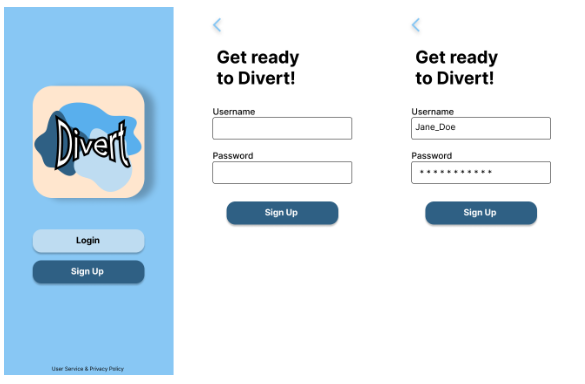
Our onboarding flow consists of users signing up for an account. We included a more expansive onboarding flow for our usability testing, but found that even without the full onboarding flow, users did not struggle with the basic functionality of the app. This suggested that our general app usage was intuitive and did not require a substantive onboarding flow.
Settings Permission Flow:
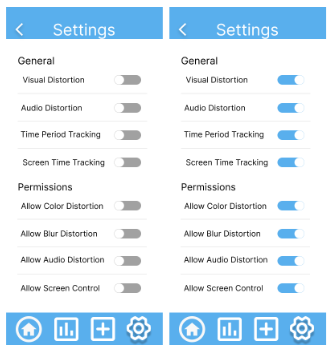
Our setting permissions flow consists of two screens, one of the settings page with permissions disabled and one of the settings page with the permissions enabled. Users are able to individually toggle each permission and our app will limit available interventions based on the permissions. The settings page can be accessed through any page with the bottom navigation bar and the settings icon has a shadow indicating that it is the active screen.
Intervention Creation Flow:
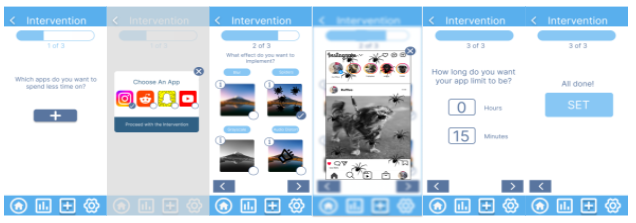
Our intervention flow is our most expansive flow and consists of many screens. Each different screen is implemented with a different option checked in order to give users the experience of choosing between different apps and intervention options. We also include screens for previewing intervention options. These preview screens can be accessed through the “i” icon on the upper left corner of each intervention option. This flow starts with users choosing a specific app to set an intervention for, transitions to choosing a specific intervention, moves on to setting a time limit for the chosen app, and concludes with a large “set” button to confirm the creation of the intervention.
Intervention Deletion or Disable Flow:
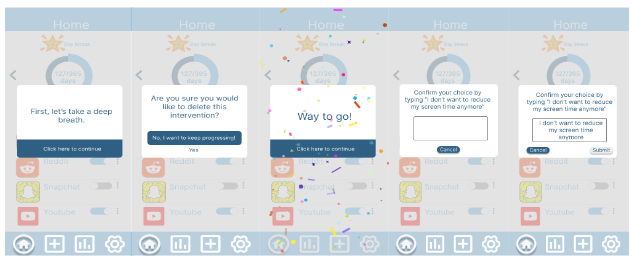
Our intervention deletion or disable flow consists of a series of “mindfulness” check screens which prompt our user to reflect on their decision to delete or disable an enabled intervention. The user has the option of keeping the intervention enabled, in which a congratulatory message will be shown. If the user chooses to continue with the deletion or disabling of the intervention, then the user will be prompted to type “I don’t want to reduce my screen time anymore” and act with intentionality.
Stats Viewing Flow:
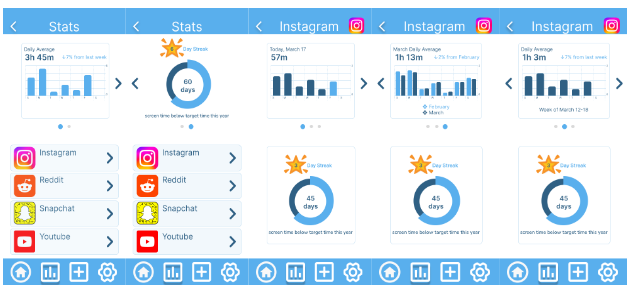
The stats viewing flow gives users a more detailed view of their screen time statistics than the charts on the home screen. Additionally, this flow supports showing screen time statistics for specific apps. In this flow, we support showing the specific screen time statistics for Instagram.
Full Prototype Flow:
Ethics
The ethics readings from CS 247B significantly impacted our design process. We were enabled to make design decisions that were both ethical and product-enhancing in these three reading areas in particular:
- Persuasive Technology: Because this reading was so early in the quarter, it was top of mind for our team as we did our initial ideation for a behavior to change. Excessive scrolling seemed to be the direct result of the three harms outlined in the paper (exploiting people’s attention, breach of privacy, and negative influence on health). Most apps, social media especially, are designed to be as enticing as possible to gather user data and sell them ads and harm user well-being, and we wanted to counter that in a unique, research-backed way.
- Nudging and Manipulation: We decided early on that our app needed to include nudges because, without them, we weren’t going to get users to stop scrolling. This article made us consider how we could do so in an effective way that still respected user autonomy. Our solution: user-driven nudging. When creating an intervention in our app, the user decides which types of distortion(s) to use, including grayscale, blurring, and audio, which app(s) to use them on, and their app time limit before the nudge begins. Invoking the distortions is not manipulative because it doesn’t violate autonomy or involve interference in the decision-making process; rather, it’s akin to libertarian paternalism because they don’t restrict the user’s freedom to use their phone. These interventions just make their phone less enticing to stare at for long periods, thus steering users’ choices in ways that reduce a harmful behavior (especially in excess).
- Privacy: These readings greatly influenced our design for collection of user data and led us to many questions around security, especially in the doomsday in-class scenario. We only require a username and password for signing up (we might add an email address, too) because our only data requirement is to be able to transfer user distortions and screen time data across devices, such as when the user gets a new phone. Because our app requires permission to access settings of other apps and to manipulate the users’ screens, we imagined a potential scenario where our app could be used in a backdoor attack. Hackers could gather user data, install malware, or perform malicious actions in apps that ours has access to. Although we didn’t build out our prototype to the point of needing to worry about security and iOS/Android integration, user security would be crucial if we move forward with our app after this class.
Our united desire as a team to build something that could help people who struggle with screen addiction and doom scrolling is ethical in that we aspire to reduce harm to users and enable them to spend time in a way that makes them feel more fulfilled. Building an app that is designed to be used less the more effective it is seems to be the perfect counter to the issues brought up in the Persuasive Technology reading and was an exciting ethical endeavor for our team.
Conclusion
In the future, we would like to study the effectiveness of our app on the various distortions by measuring the amount of people who choose specific effects and the amount of time it takes for them to leave the app. Additionally, for the purpose of 247B, we prioritized novelty while recognizing potential challenges with feasibility. Because Distort is an app that alters other apps, specific technological challenges will most likely be encountered as we navigate Apple’s system stack. We believe that investigating this integration would be our team’s next objective in the app’s milestone.
Within the app, more development of our color scheme and navigation is needed, especially when considering accessibility. Currently, Distort is built on a blue-themed environment and contrast, readability, and clickability are limited in certain areas. Expanding on the color palette and incorporating other accessibility features would be necessary steps in creating an equitable platform.
As a group, we each learned to navigate through lots of design issues. Our very first hi-fi prototype was completely scrapped, and we put in considerable effort to iterate and improve in such a short amount of time. In addition, this was a completely random team with extremely variable skill sets. We had developers, bioengineers, designers, PM, and policy students and this allowed for a broad range of influence and ideas. Learning to think in many facets allowed us to grow as team members and leaders in our respective industries.